


在性能排查问题中,一旦涉及到MySQL和操作系统一些协调问题,总是困难重重。当然初步的cpu,io,网络等问题还是好判断的,但更细致的内容,就不好排查。但也不是没办法,比如 perf,strace等调试也能做到一定的程度。但这样分析难度增加,还有可能导致数据库穷住等情况发生。
从MySQL 8.0.27开始,为了帮助监控和故障排除,Performance Schema将线程的名称匹配到操作系统。这使得显示线程名称的实用程序(如调试器和Unix ps命令)能够显示不同的mysqld线程名称,而不是“mysqld”。该特性目前支持Linux、macOS和Windows操作系统。
MySQL 8.0.27 Release Performance Schema Notes
To assist monitoring and troubleshooting, the Performance Schema instrumentation is now used to export names of instrumented threads to the operating system. This enables utilities that display thread names, such as debuggers and the Unix ps command, to display distinct mysqld thread names rather than “mysqld”. This feature is supported only on Linux, macOS, and Windows. For more information, see The setup_instruments Table. (WL #14587)
1.先看看MySQL8.0.33版本ps线程表显示的内容对比:
线程表额外多了几个字段,一个是内存相统计和采集信息。更直观的通过线程id跟踪内存使用情况。
mysql> SELECT * FROM performance_schema.threads Limit 1\G;
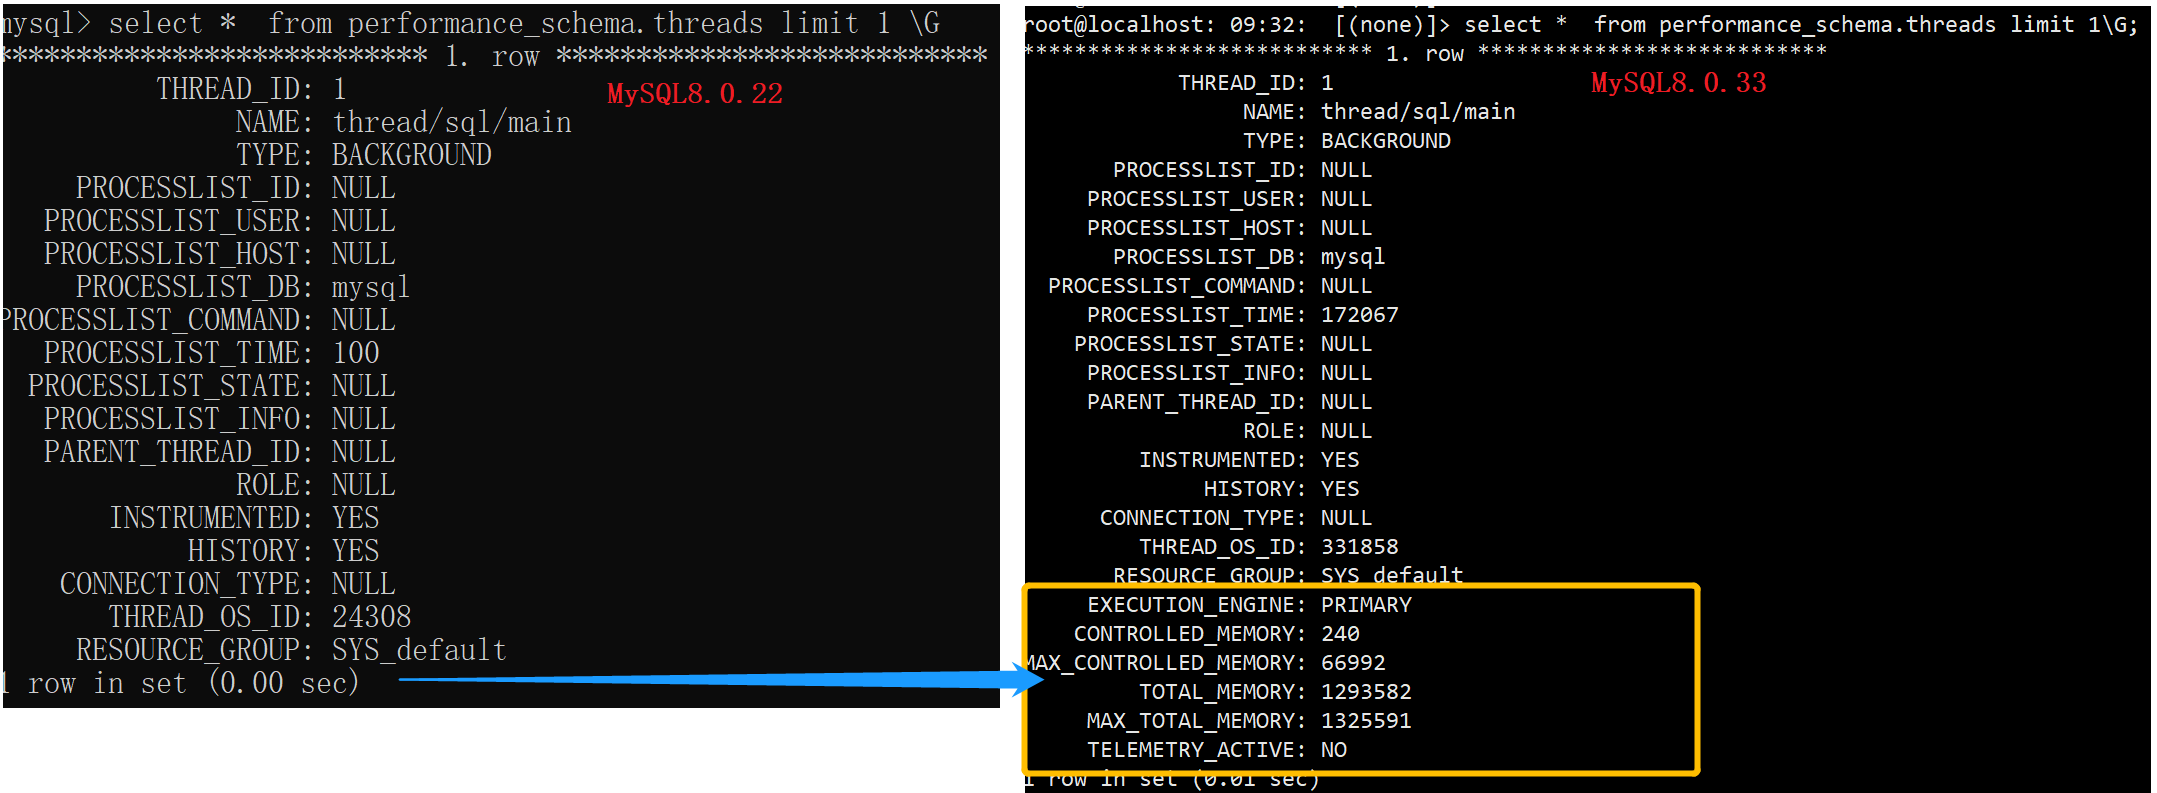
额外字段说明:
| 字段 | 说明 |
|---|---|
| EXECUTION_ENGINE | 查询执行引擎。该值为PRIMARY或SECONDARY。用于MySQL数据库服务和热浪,其中PRIMARY引擎是InnoDB,SECONDARY引擎是热浪RAPID(HeatWave中使用)。 MySQL 8.0.29中添加. |
| CONTROLLED_MEMORY | 线程使用的受控内存量。8.0.31中添加 |
| MAX_CONTROLLED_MEMORY | 在线程执行过程中看到的CONTROLLED_MEMORY的最大值。8.0.31中添加 |
| TOTAL_MEMORY | 线程当前使用的内存量,无论是否受控制。8.0.31中添加 |
| MAX_TOTAL_MEMORY | 在线程执行期间看到的TOTAL_MEMORY的最大值。8.0.31中添加 |
| TELEMETRY_ACTIVE | 线程是否连接了活动TELEMETRY(高速采集数据的功能,提供更实时、更高速、更精确的线程信息8.0.33中添加 |
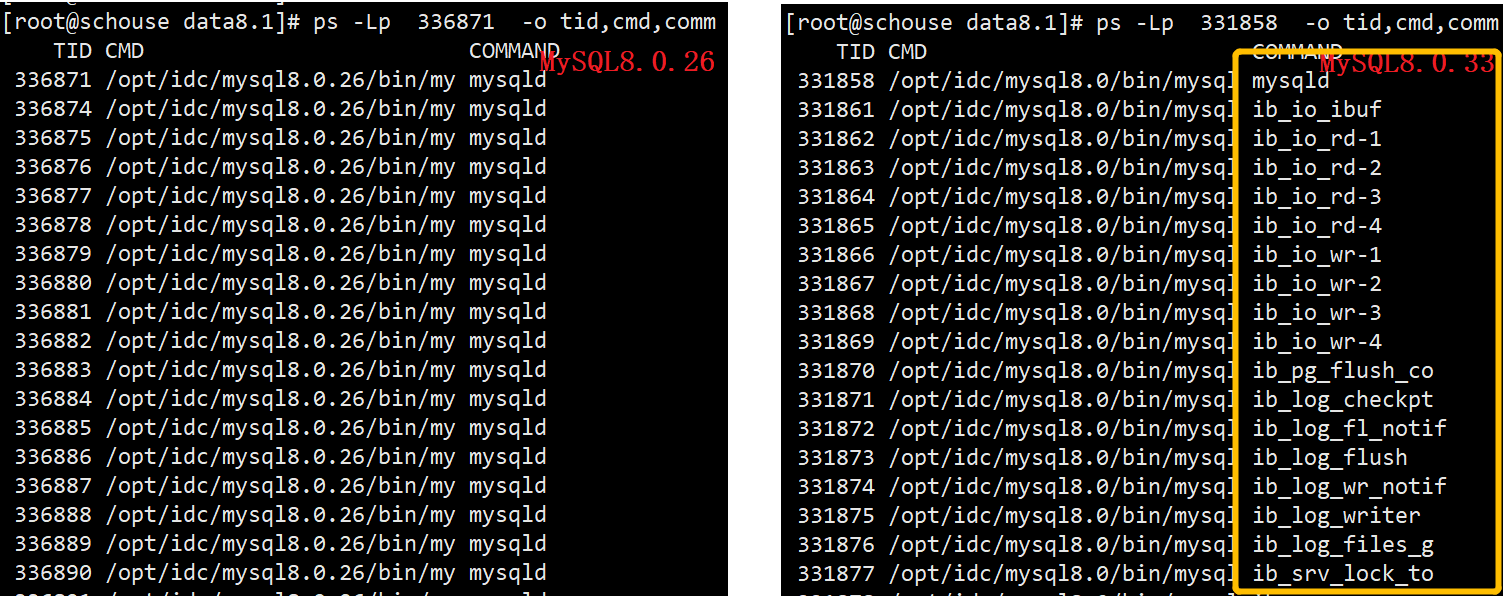
2.Linux ps线程显示:
可以看到建立的线程,从显示名称,大致也都能判断是那些对应mysql线程。比如:ib_io_rd:innodb_read_io_threads线程,ib_io_wr:innodb_write_io_threads线程
ib_pg_flush_co & ib_log_checkpt: redo log刷新 等
ps -Lp `pgrep mysqld` -o tid,cmd,comm
可以进步登录相关线程id,查看资源使用情况。比如,proc下线程编号对应的资源使用。fd,io limits numa_maps,smaps 等。可以更好的分析,当前线程使用的资源情况。
shell>cd /proc/331870
shell>ll
dr-xr-xr-x  2 mysql mysql 0 May 22 16:18 attr
-rw-r--r--  1 mysql mysql 0 May 22 16:18 autogroup
-r--r--r--  1 mysql mysql 0 May 22 16:18 cgroup
-r--r--r--  1 mysql mysql 0 May 22 16:18 cmdline
-rw-r--r--  1 mysql mysql 0 May 22 16:18 comm
-r--r--r--  1 mysql mysql 0 May 22 16:18 cpuset
lrwxrwxrwx  1 mysql mysql 0 May 22 16:18 cwd -> /opt/data8.0/data
lrwxrwxrwx  1 mysql mysql 0 May 22 16:18 exe -> /opt/idc/mysql8.0/bin/mysqld
dr-x------  2 mysql mysql 0 May 22 16:18 fd
-r--------  1 mysql mysql 0 May 22 16:18 io
-r--r--r--  1 mysql mysql 0 May 22 16:18 limits
dr-xr-xr-x  5 mysql mysql 0 May 22 16:18 net
-r--r--r--  1 mysql mysql 0 May 22 16:18 numa_maps
-r--r--r--  1 mysql mysql 0 May 22 16:18 smaps
。。。
也可以通过指定top pid查看资源消耗:
shell# top -p 331861
top - 16:52:47 up 132 days,  1:40,  4 users,  load average: 0.01, 0.03, 0.00
Tasks:   1 total,   0 running,   1 sleeping,   0 stopped,   0 zombie
%Cpu0  :  0.0 us,  1.7 sy,  0.0 ni, 98.3 id,  0.0 wa,  0.0 hi,  0.0 si,  0.0 st
MiB Mem :   1826.7 total,    135.1 free,   1149.9 used,    541.8 buff/cache
MiB Swap:      0.0 total,      0.0 free,      0.0 used.    520.9 avail Mem

    PID USER      PR  NI    VIRT    RES    SHR S  %CPU  %MEM     TIME+ COMMAND
 331861 mysql     20   0 1387952 521780  19696 S   0.0  27.9  24:00.86 ib_io_ibuf
3.线程信息
通过Linux ps和基本命令行一起在shell中运行各种命令,从而从操作系统级别,统计当前的mysql活动情况:
shell# ps -Lp 331858  -o s,comm,wchan | sort | uniq -c | sort -nbr | head -10
      5 S connection      x64_sys_ppoll
      3 D connection      iomap_dio_rw
      1 S xpl_worker-2    -
      1 S xpl_worker-1    -
      1 S xpl_accept-2    futex_wait_queue_me
      1 S xpl_accept-1    do_epoll_wait
      1 S sig_handler     -
      1 S mysqld          x64_sys_poll
      1 S ib_srv_purge    -
      1 S ib_srv_mon      -
      1 S ib_srv_err_mon  -
      1 S ib_src_main     hrtimer_nanosleep
      1 S ib_pg_flush_co  -
      1 S ib_log_writer   -
      1 S ib_log_flush    -
      1 S ib_log_checkpt  -
      1 S ib_io_wr-2      -
      1 S ib_io_wr-1      -
      1 S ib_io_rd-2      -
      1 S ib_io_rd-1      -
      1 S ib_io_ibuf      -
      1 S ib_dict_stats   -
      1 S ib_clone_gtid   -
。。。
通过上面ps mysql对应线程统计,在上面ps结果中,有5个用户连接线程忙于在CPU上运行(或者至少尝试在CPU上运行),3个线程在D状态下等待,在Linux的iomap_dio_rw内核函数中进入睡眠状态。还有mysql线程ib_log_flush 刷新日志,ib_log_checkpt检查点,ib_srv_purge 清除等。
当然,这只是一个快照,为了更好地了解一段时间内发生的情况,应该多次运行这个命令以获得更大的样本量。
总结
通过MySQL8.0.27提供的threads具体显示信息,可以更准确的排查问题。对于DBA来说多了更有效的排查手段。
