


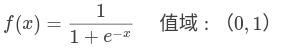
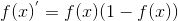
sigmoid 激活函数定义:
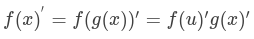
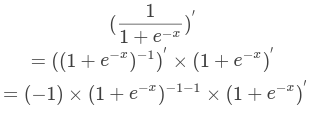
导数推理过程:
再求解:
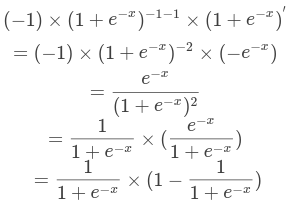
由原函数为 所以最后导数可化简为:
sigmoid 作用:
取值范围在0~1之间。
某一个事件发生的情况,0.5(即50%) 是该结果的分界,选择该激活函数时应该是在0.5中心对称。
代码实现原函数和导数函数:
class Sigmoid:
    def __init__(self, w):
        self.weight_input = w
        self.output = 0.0
    # 原函数
    def obj(self):
        self.output = 1.0 / (1.0 + np.exp(- self.weight_input))
        return self.output
    # 导数
    def der(self):
        if self.output == 0.0:
            self.output = 1.0 / (1.0 + np.exp(- self.weight_input))
        return self.output * (1 - self.output)
左边为原函数图像,右边为该导数图像:
图像python代码实现:
import math
import matplotlib.pyplot as plt
import numpy as np

# 以类实现
class Sigmoid:
    def __init__(self, w):
        self.weight_input = w
        self.output = 0.0
    # 原函数
    def obj(self):
        self.output = 1.0 / (1.0 + np.exp(- self.weight_input))
        return self.output
    # 导数
    def der(self):
        if self.output == 0.0:
            self.output = 1.0 / (1.0 + np.exp(- self.weight_input))
        return self.output * (1 - self.output)

# 返回间隔均匀的100个样本,计算间隔为[start, stop]。
x = np.linspace(-10, 10, 100)
y_obj = Sigmoid(x).obj()
y_der = Sigmoid(x).der()

# 画图,原函数
plt.figure(figsize=(12, 12))
plt.subplot(2,2,1)
plt.plot(x, y_obj, color='red', label='primitive function')
plt.ylim((-0.2, 1.2))
plt.legend()
plt.xlabel(r'$f(x) = \frac{1}{1+e^{-x}}$', fontsize=18, color='red')
# 导数
plt.subplot(2,2,2)
plt.plot(x, y_der, color='blue', label='derived function')
plt.ylim((-0.1, 0.5))
plt.legend()
plt.xlabel('f(x)\' = f(x)*(1-f(x))', fontsize=18, color='blue')
plt.show()
文章转载自该帐号已冻结,如果涉嫌侵权,请发送邮件至:contact@modb.pro进行举报,并提供相关证据,一经查实,墨天轮将立刻删除相关内容。
