


学完 Python 的语法后,很多新手会感到困惑,因为他们可能只会使用命令行,而不知道如何实现自己的需求,例如创建图形用户界面(GUI)、开发游戏、编写 Web 程序或操作浏览器和 Excel 等。如果想使用Python做一些实际的应用,需要掌握合适的库。后续的几个项目将会持续介绍一些实用的库。
openpyxl
是一个Python库,用于读/写Excel 2010 xlsx/xlsm/xltx/xltm 文件。 openpyxl
支持很多excel操作:读/写/合并单元格、过滤/排序数据、添加图表、图像......
安装
使用pip安装: pip install openpyxl
文档:https://openpyxl.readthedocs.io/en/stable/tutorial.html
中文文档(较长时间未更新)https://openpyxl-chinese-docs.readthedocs.io/zh_CN/latest/tutorial.html
如果你对这个库感兴趣,可以阅读文档的教程。下面是两个简单示例。
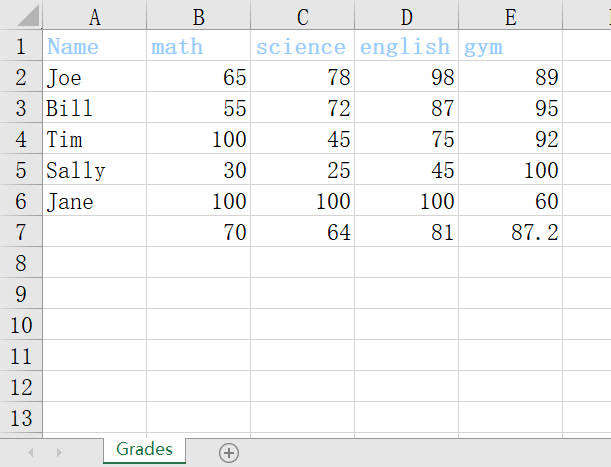
例1 统计平均分
将成绩数据写入xlsx,并统计平均分。
from openpyxl import Workbook, load_workbook
from openpyxl.utils import get_column_letter
from openpyxl.styles import Font

data = {
    "Joe": {
        "math": 65,
        "science": 78,
        "english": 98,
        "gym": 89
    },
    "Bill": {
        "math": 55,
        "science": 72,
        "english": 87,
        "gym": 95
    },
    "Tim": {
        "math": 100,
        "science": 45,
        "english": 75,
        "gym": 92
    },
    "Sally": {
        "math": 30,
        "science": 25,
        "english": 45,
        "gym": 100
    },
    "Jane": {
        "math": 100,
        "science": 100,
        "english": 100,
        "gym": 60
    }
}

wb = Workbook() # 创建表格
ws = wb.active # 获取工作簿(worksheet)
ws.title = "Grades"

headings = ['Name'] + list(data['Joe'].keys())
ws.append(headings)

for person in data:
    grades = list(data[person].values())
    ws.append([person] + grades)

for col in range(2, len(data['Joe']) + 2):
    char = get_column_letter(col)
    ws[char + "7"] = f"=SUM({char + '2'}:{char + '6'})/{len(data)}"

for col in range(1, 6):
    ws[get_column_letter(col) + '1'].font = Font(bold=True, color="0099CCFF")

wb.save("NewGrades.xlsx")
代码来自https://github.com/techwithtim/ExcelPythonTutorial
例2 绘制图表
官方文档的一个示例,写入数据并且绘制条形图。
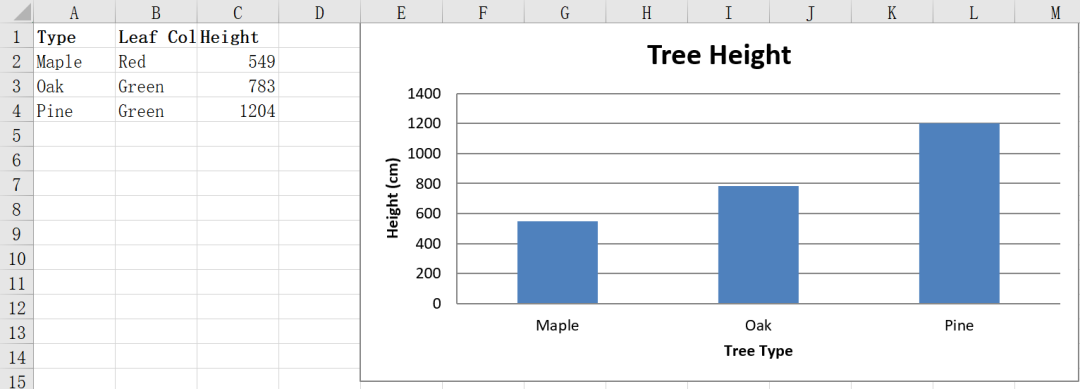
from openpyxl import Workbook


wb = Workbook()
ws = wb.active
treeData = [["Type", "Leaf Color", "Height"], ["Maple", "Red", 549],
            ["Oak", "Green", 783], ["Pine", "Green", 1204]]

# 将数据追加写入wb
for row in treeData:
    ws.append(row)

# 改变字体
from openpyxl.styles import Font
ft = Font(bold=True)
for row in ws["A1:C1"]:
    for cell in row:
        cell.font = ft

# 绘制图表 BarChart()
from openpyxl.chart import BarChart, Series, Reference
chart = BarChart()
chart.type = "col"
chart.title = "Tree Height"
chart.y_axis.title = 'Height (cm)'
chart.x_axis.title = 'Tree Type'
chart.legend = None
data = Reference(ws, min_col=3, min_row=2, max_row=4, max_col=3)
categories = Reference(ws, min_col=1, min_row=2, max_row=4, max_col=1)
chart.add_data(data)
chart.set_categories(categories)
ws.add_chart(chart, "E1")
wb.save("TreeData.xlsx")
如果有更多数据分析的要求,可以考虑
pandas
文章转载自一只大鸽子,如果涉嫌侵权,请发送邮件至:contact@modb.pro进行举报,并提供相关证据,一经查实,墨天轮将立刻删除相关内容。
