


安装python包
pip install influxdb==5.3.0pip install psutil==5.6.3
编写脚本
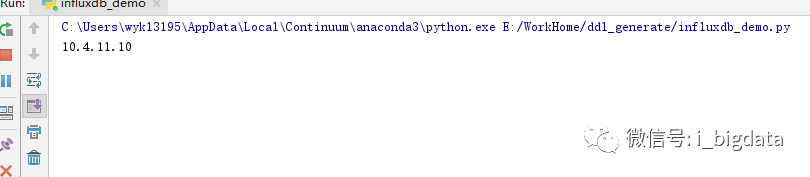
import _threadimport timeimport socketimport psutilfrom influxdb import InfluxDBClientclient=InfluxDBClient('localhost',8086,'u_wyk13195','p_wyk13195','my_monitor')#获取本机IPdef get_ip():s = socket.socket(socket.AF_INET, socket.SOCK_DGRAM)try:# doesn't even have to be reachables.connect(('10.255.255.255', 0))IP = s.getsockname()[0]except:IP = '127.0.0.1'finally:s.close()return IPip = get_ip()print(ip)#获取cpu信息def get_cpu(sec):while True:time.sleep(sec)info=psutil.cpu_percent(0)text=[{"measurement":"cpu_info","tags":{"host":ip},"fields":{"percent":info}}]client.write_points(text)def get_memory(sec):while True:time.sleep(sec)info=psutil.virtual_memory()text=[{"measurement":"memory_info","tags":{"host":ip},"fields":{"mem_percent":info.percent,"mem_used":info.used,"mem_free":info.free,}}]client.write_points(text)def get_disk(sec):while True:time.sleep(sec)info=psutil.disk_usage('/')text=[{"measurement":"disk_info","tags":{"host":ip},"fields":{"disk_used":info.used,"disk_free":info.free,"disk_percent":info.percent,}}]client.write_points(text)def get_network(sec):while True:time.sleep(sec)#print(psutil.net_io_counters(pernic=True))info = psutil.net_io_counters(pernic=True)['WLAN 3']text=[{"measurement":"network_info","tags":{"host":ip},"fields":{"bytes_sent":info.bytes_sent,"bytes_recv":info.bytes_recv,}}]client.write_points(text)try:_thread.start_new_thread( get_cpu,(10,))except:print("ERROR:cpu unable to start thread")try:_thread.start_new_thread( get_memory, (10,))except:print("ERROR:memory unable to start thread")try:_thread.start_new_thread( get_disk, (10,))except:print("ERROR:disk unable to start thread")try:_thread.start_new_thread( get_network,(10,))except:print("ERROR:net unable to start thread")while 1:pass
启动influxdb
nohup $INFLUXDB18_HOME/usr/bin/influxd -config $INFLUXDB18_HOME/etc/influxdb/influxdb.conf &>$INFLUXDB18_HOME/log &
启动grafana
CentOS7:systemctl restart grafana-serversystemctl enable grafana-serverCentOS6:service grafana-server restartchkconfig grafana-server on
启动脚本
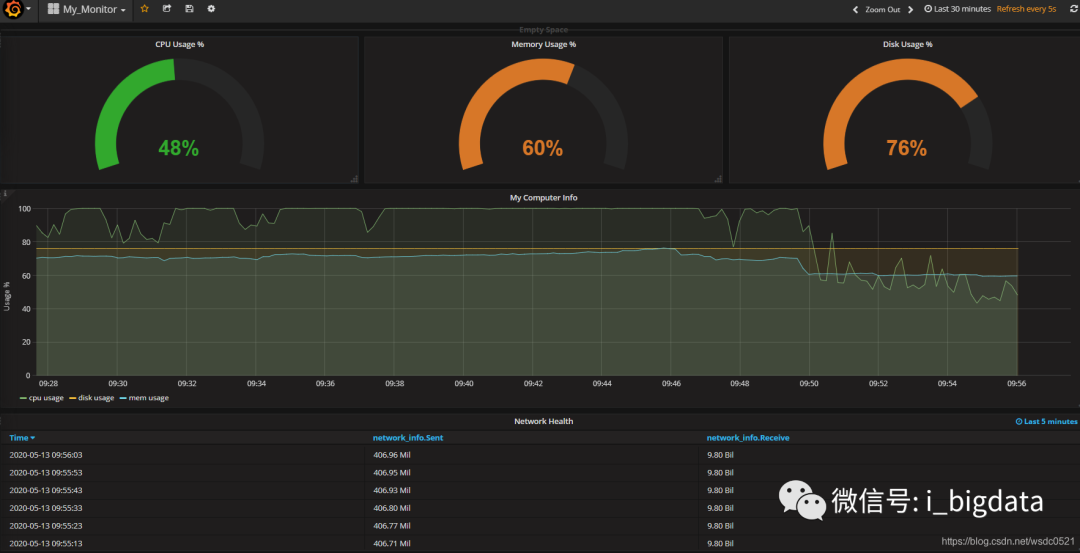
Grafana报表
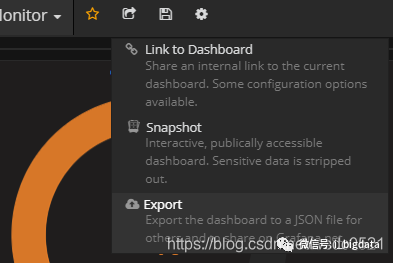
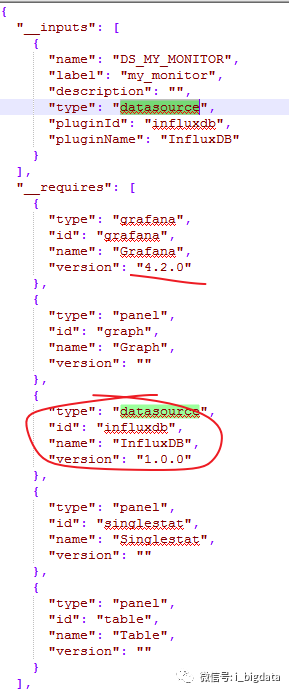
导出报表:
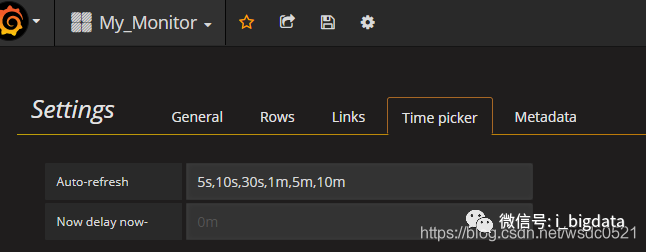
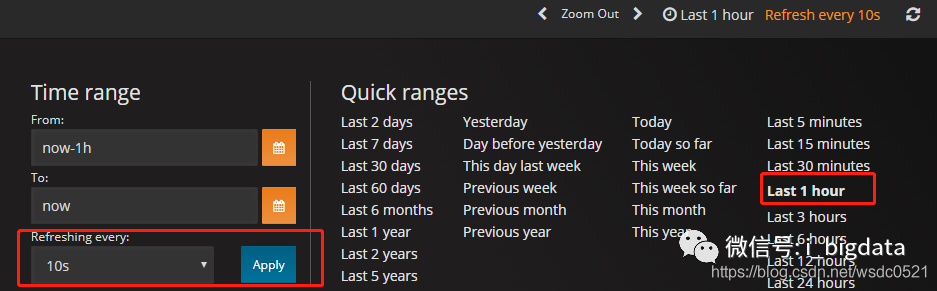
配置自动刷新规则:
文章转载自爱玩大数据,如果涉嫌侵权,请发送邮件至:contact@modb.pro进行举报,并提供相关证据,一经查实,墨天轮将立刻删除相关内容。
