


基于prometheus的指标监控
prometheus的架构
prometheus的数据模型
prometheus的四种数据类型
Counter
Gauge
Histogram
Summary
go-zero中的指标监控
Docker运行Prometheus
基于prometheus的指标监控
没错,Prometheus是《异形》前传电影普罗米修斯,今天由我来给大家写个普罗米修斯的影评......首先,我们从电影架构开始说起
prometheus的架构
prometheus的工作基本原理是通过HTTP协议周期性抓取被监控组件的状态,这样做的好处是任意组件只要提供HTTP接口就可以接入监控系统,不需要任何SDK或者其他的集成过程。这样做非常适合虚拟化环境比如VM或者Docker
Prometheus 的整体架构以及生态系统组件如下图所示:
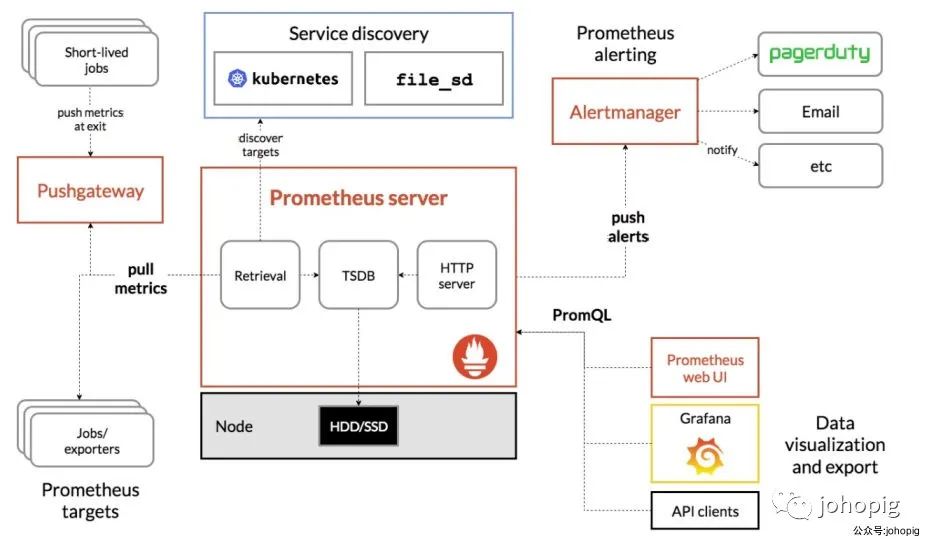
从上面的架构图我们可以知道
Prometheus Server通过注册中心/配置文件找到需要收集指标的目标
Prometheus Server的工作流:
业务系统将数据推送到推送网关,然后Prometheus Server通过网关拉取监控指标 业务系统直接将指标数据推送到Prometheus Server
prometheus的数据模型
Prometheus对所有的存储都是按时间序列去实现的
通过 metrics
(指标名称) label
(一个或多个标签) 组成一条时间序列,不同的label表示不同的时间序列,可以把metrics看作是传统数据库的表名,label是字段, timestamp是主键,还有一个float64字段则是值。(prometheus里所有的值都是按float64存储的)
最后组成的标示类似这样:http_requests_total{method=”POST”,endpoint=”/api/tracks”} 100
prometheus的四种数据类型
Counter
用于累计值,例如记录请求次数、错误发生次数(value就代表了当前累计的次数,只会一直增加,不会减少)
Gauge
常规数值,例如 温度变化、内存使用变化。可变大,可变小
Histogram
直方图,常用于跟踪事件发生的规模,例如:请求耗时、响应大小。它特别之处是可以对记录的内容进行分组,提供count和sum全部值的功能
Summary
Summary和Histogram十分相似,常用于跟踪事件发生的规模,例如:请求耗时、响应大小。同样提供 count 和 sum 全部值的功能
go-zero中的指标监控
go-zero实现了上面Prometheus架构图中获取指标数据两种方式
rpc服务 和 api网关 启动时都会注册handler(exporter)或者启动一个reporter (当然,启用的前提是在配置文件中配置了prometheus的host等信息),然后通过拦截器对指标数据进行收集存储,最后再主动上报或者等待Prometheus Server抓取(定时flush)
初始化prometheus、注册handler、启动reporter
// core/service/serviceconf.go
func (sc ServiceConf) SetUp() error {
 if len(sc.Log.ServiceName) == 0 {
  sc.Log.ServiceName = sc.Name
 }
  // 初始化日志
 if err := logx.SetUp(sc.Log); err != nil {
  return err
 }

 sc.initMode()

  // 启动 prometheus client handler
  // 属于上面提到的第一种方式
 prometheus.StartAgent(sc.Prometheus)

  // 如果配置了推送地址,则创建一个reporter
  // 属于上面提到的第二种方式
 if len(sc.MetricsUrl) > 0 {
  stat.SetReportWriter(stat.NewRemoteWriter(sc.MetricsUrl))
 }

 return nil
}
// core/prometheus/agent.go
func StartAgent(c Config) {
   once.Do(func() {
   // 表明未开启prometheus监控,直接返回
    if len(c.Host) == 0 {
     return
    }

   // 监听端口,等待Prometheus Server的调用
   // 这种方式的话不用我们做什么
    threading.GoSafe(func() {
     http.Handle(c.Path, promhttp.Handler())
     addr := fmt.Sprintf("%s:%d", c.Host, c.Port)
     logx.Infof("Starting prometheus agent at %s", addr)
     if err := http.ListenAndServe(addr, nil); err != nil {
      logx.Error(err)
     }
    })
   })
}
// core/stat/metrics.go
func SetReportWriter(writer Writer) {
 writerLock.Lock()
  // 指定reporter
  // 通过reporter将数据推送给Prometheus Server
 reportWriter = writer
 writerLock.Unlock()
}
拦截器
// rpc server拦截器 rpc client、api 类似
func UnaryStatInterceptor(metrics *stat.Metrics) grpc.UnaryServerInterceptor {
 return func(ctx context.Context, req interface{}, info *grpc.UnaryServerInfo,
  handler grpc.UnaryHandler) (resp interface{}, err error) {
  defer handleCrash(func(r interface{}) {
   err = toPanicError(r)
  })

  startTime := timex.Now()
  defer func() {
   duration := timex.Since(startTime)
      // 通过拦截器添加任务
   metrics.Add(stat.Task{
    Duration: duration,
   })
   logDuration(ctx, info.FullMethod, req, duration)
  }()

  return handler(ctx, req)
 }
}

func UnaryPrometheusInterceptor() grpc.UnaryServerInterceptor {
 return func(ctx context.Context, req interface{}, info *grpc.UnaryServerInfo, handler grpc.UnaryHandler) (
  interface{}, error) {
  startTime := timex.Now()
  resp, err := handler(ctx, req)
    // histogram
  metricServerReqDur.Observe(int64(timex.Since(startTime)/time.Millisecond), info.FullMethod)
    // counter
  metricServerReqCodeTotal.Inc(info.FullMethod, strconv.Itoa(int(status.Code(err))))
  return resp, err
 }
}
执行者(最终是通过他们上报数据到prometheus server)
go-zero的定时任务结构体及任务容器的接口。「主动上报数据的方式也有两种:定时上报、主动触发上报」
// core/executors/periodicalexecutor.go
type (
 // A type that satisfies executors.TaskContainer can be used as the underlying
 // container that used to do periodical executions.
 TaskContainer interface {
  // AddTask adds the task into the container.
  // Returns true if the container needs to be flushed after the addition.
  AddTask(task interface{}) bool
  // Execute handles the collected tasks by the container when flushing.
  Execute(tasks interface{})
  // RemoveAll removes the contained tasks, and return them.
  RemoveAll() interface{}
 }

 PeriodicalExecutor struct {
  commander chan interface{}
  interval  time.Duration
  container TaskContainer
  waitGroup sync.WaitGroup
  // avoid race condition on waitGroup when calling wg.Add/Done/Wait(...)
  wgBarrier   syncx.Barrier
  confirmChan chan lang.PlaceholderType
  guarded     bool
  newTicker   func(duration time.Duration) timex.Ticker
  lock        sync.Mutex
 }
)

// 起一个goroutine来处理任务
func (pe *PeriodicalExecutor) backgroundFlush() {
 threading.GoSafe(func() {
  ticker := pe.newTicker(pe.interval)
  defer ticker.Stop()

  var commanded bool
  last := timex.Now()
  for {
   select {
      // 主动触发上报
   case vals := <-pe.commander:
    commanded = true
    pe.enterExecution()
    pe.confirmChan <- lang.Placeholder
    pe.executeTasks(vals)
    last = timex.Now()
      // 定时上报
   case <-ticker.Chan():
    if commanded {
     commanded = false
    } else if pe.Flush() {
     last = timex.Now()
    } else if timex.Since(last) > pe.interval*idleRound {
     pe.lock.Lock()
     pe.guarded = false
     pe.lock.Unlock()

     // flush again to avoid missing tasks
     pe.Flush()
     return
    }
   }
  }
 })
}
// core/stat/metrics.go
func (c *metricsContainer) Execute(v interface{}) {
 pair := v.(tasksDurationPair)
 tasks := pair.tasks
 duration := pair.duration
 drops := pair.drops
 size := len(tasks)
 report := &StatReport{
  Name:          c.name,
  Timestamp:     time.Now().Unix(),
  Pid:           c.pid,
  ReqsPerSecond: float32(size) / float32(LogInterval/time.Second),
  Drops:         drops,
 }

  ......

 log(report)
}

func log(report *StatReport) {
 writeReport(report)
 logx.Statf("(%s) - qps: %.1f/s, drops: %d, avg time: %.1fms, med: %.1fms, "+
  "90th: %.1fms, 99th: %.1fms, 99.9th: %.1fms",
  report.Name, report.ReqsPerSecond, report.Drops, report.Average, report.Median,
  report.Top90th, report.Top99th, report.Top99p9th)
}

func writeReport(report *StatReport) {
 writerLock.Lock()
 defer writerLock.Unlock()
   ......
  if err := reportWriter.Write(report); err != nil {
    ......
}

func (rw *RemoteWriter) Write(report *StatReport) error {
 bs, err := json.Marshal(report)
 .....
  // endpoint就是推送到prometheus server的地址
 resp, err := client.Post(rw.endpoint, "application/json", bytes.NewBuffer(bs))
 .....
}
Docker运行Prometheus
首先编写配置文件
global:
  scrape_interval: 1m
  scrape_timeout: 10s
  evaluation_interval: 1m
scrape_configs:
- job_name: api
  static_configs:
  - targets:
    - docker.for.mac.localhost:9102
    labels:
      app: gym
      env: test
      instance: 127.0.0.1:8888
这里有几点要注意的:
在终端写配置文件的时候尽量用空格来代替tab,我本地是mac环境,写完之后放到docker里就报解析错误。。。 我的示例里服务是跑在本地的,配置文件中的targets写127.0.0.1:9102是访问不了的,即使使用--net=host在docker for mac中也是不行的,如果想要在docker 容器中访问宿主机的端口就必须要用 docker.for.mac.localhost
(我试了试用docker0的网关地址和--net=host都不成功)确保端口没有被占用😭,我本地开了clashx的客户端,刚好占用了9090端口,结果导致访问的时候一直显示个"hello":"clash"。。。。
启动Prometheus容器
映射9090端口并且将配置文件挂载
docker run -itd -p 9090:9090 \
-v /Users/johopig/Documents/etc/prometheus.yml:/etc/prometheus/prometheus.yml \
--name prom prom/prometheus
浏览器访问
在浏览器中输入http://127.0.0.1:9090/然后点击status就可以看到如下画面。可以清晰的看到job的状态还有label
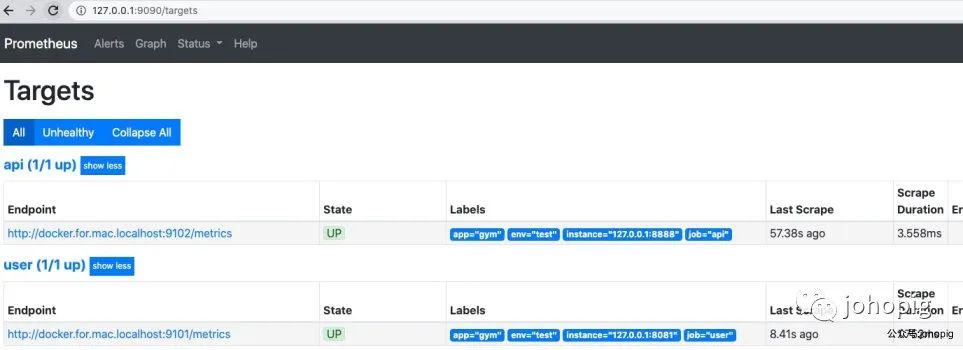
点击Graph,并且先提前在浏览器get调用一下你的api网关,过一分钟之后再再搜索框中输入http_server_requests_code_total,可以看到以下的画面
其中http_server_requests_code_total指标中code值为http的状态码
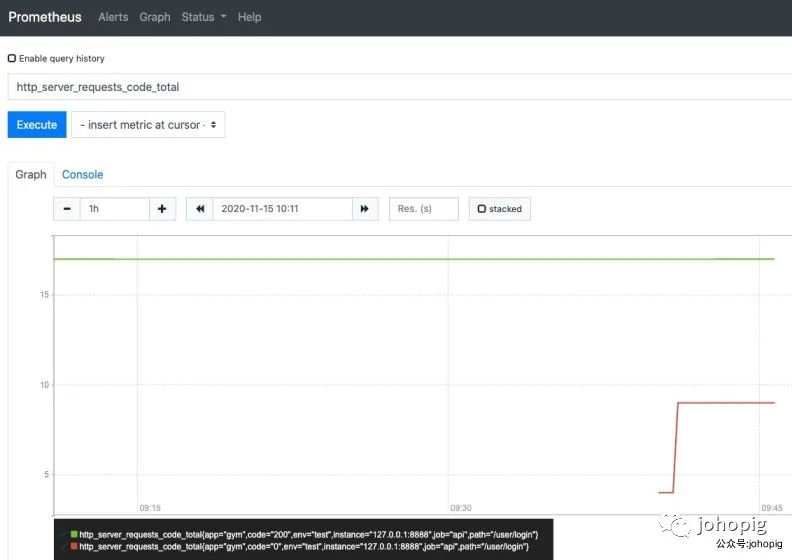
Console界面主要展示了查询的指标结果,Graph界面为我们提供了简单的图形化的展示界面,我们一般使用Grafana做图形化的展示,用docker安装的话也是非常便利的,只不过要结合指标来进行可视化绘制,这里就不讲了(其实是因为我也还没弄哈哈哈哈...)
