PMM是一个免费的开源工具,下载量超过250,000,拥有活跃的用户。
它能够帮助DBA,开发人员和DevOps团队管理复杂的数据库环境,并获得深入的了解。在GitHub上可以获得大量PMM资源。

目前Percona首页已专门开放一个区域,用作PMM社区的建设。

在社区中来自全球的开发者可以共享自己的代码,包括以下:
Dashboards
Exporters
Documentation
Contributions to the Percona Community Blog
Video Tutorials or Testimonials
UI Enhancements
New Features and Functionality
Bug Fixes
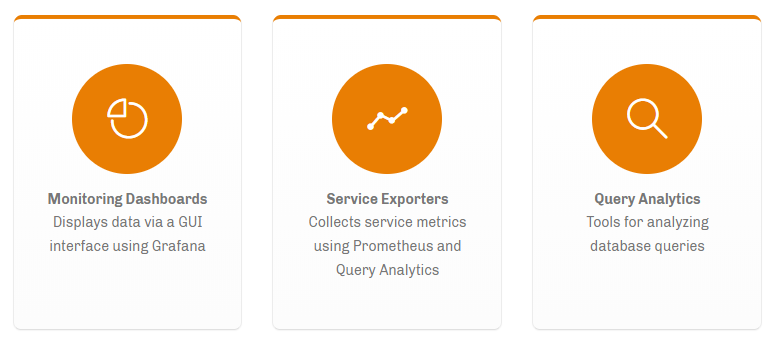
目前主要有3个大方向:
帅气的监控面板与GUI
丰富的Exporter完善各类其他种类的数据库
查询分析器,有助于发现各种SQL问题
PMM针对Linux提供了很多指标,并构建了对应的Exporters和Dashboards 但这还远远不够。最新的Prometheus Exporters涵盖了20多种数据库,但到目前为止只有6个已集成到PMM中。
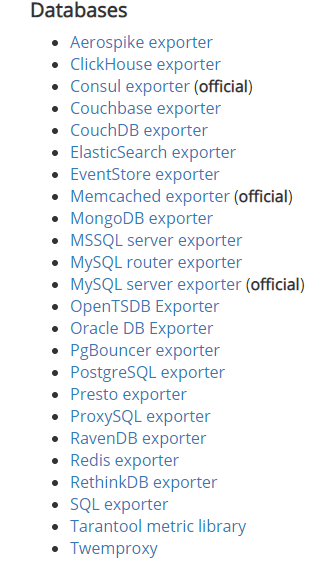
https://prometheus.io/docs/instrumenting/exporters/
那么今天的实验内容就是添加比较常用两种NoSQL到PMM中:Redis和ES,我们稳稳的出发吧!

PMM添加Redis监控
(模板作者oliver006)
1 被监控的Redis数据库操作:
# 下载安装包:
wget https://github.com/oliver006/redis_exporter/releases/download/v1.3.5/redis_exporter-v1.3.5.linux-amd64.tar.gz
# 看看里面都有啥:
tar -zxvf redis_exporter-v1.3.5.linux-amd64.tar.gzcd redis_exporter-v1.3.5.linux-amd64[root@localhost redis_exporter-v1.3.5.linux-amd64]# ls -ltotal 8488-rw-r--r-- 1 root root 1063 Dec 17 02:44 LICENSE-rw-r--r-- 1 root root 10412 Dec 17 02:44 README.md-rwxr-xr-x 1 root root 8675328 Dec 17 02:44 redis_exporter
# 查看下帮助,看看参数语法
[root@localhost redis_exporter-v1.3.5.linux-amd64]# ./redis_exporter --helpUsage of ./redis_exporter:-check-keys stringComma separated list of key-patterns to export value and length/size, searched for with SCAN-check-single-keys stringComma separated list of single keys to export value and length/size-config-command stringWhat to use for the CONFIG command (default "CONFIG")-connection-timeout stringTimeout for connection to Redis instance (default "15s")-debugOutput verbose debug information-export-client-listWhether to scrape Client List specific metrics-include-system-metricsWhether to include system metrics like e.g. redis_total_system_memory_bytes-is-tile38Whether to scrape Tile38 specific metrics-log-format stringLog format, valid options are txt and json (default "txt")-namespace stringNamespace for metrics (default "redis")-redis-only-metricsWhether to also export go runtime metrics-redis.addr stringAddress of the Redis instance to scrape (default "redis://localhost:6379")-redis.password stringPassword of the Redis instance to scrape-script stringPath to Lua Redis script for collecting extra metrics-set-client-nameWhether to set client name to redis_exporter (default true)-skip-tls-verificationWhether to to skip TLS verification-tls-client-cert-file stringName of the client certificate file (including full path) if the server requires TLS client authentication-tls-client-key-file stringName of the client key file (including full path) if the server requires TLS client authentication-versionShow version information and exit-web.listen-address stringAddress to listen on for web interface and telemetry. (default ":9121")-web.telemetry-path stringPath under which to expose metrics. (default "/metrics")
# 启动redis_exporter客户端
[root@localhost redis_exporter-v1.3.5.linux-amd64]# ./redis_exporter -redis.addr redis://localhost:6380 --redis.password *******INFO[0000] Redis Metrics Exporter v1.3.5 build date: 2019-12-16-18:43:41 sha1: 14dda66e724e45935782db610aca803594107ff0 Go: go1.13.5 GOOS: linux GOARCH: amd64INFO[0000] Providing metrics at :9121/metrics
# 参数说明:
-redis.addr:
Redis实例的地址,默认为redis://localhost:6379
-redis.password:
Redis实例的密码,默认为""(无密码)。
-set-client-name:
客户端名字 默认redis_exporter
-namespace:
指标的命名空间,默认为redis
-connection-timeout:
连接到Redis实例的超时时间,默认为“ 15s”(采用Golang时长格式)
-web.listenaddress:
redis_exporter启动端口,默认9121
# 如修改其他端口9122:
./redis_exporter redis//localhost:6379 & -web.listenaddress 0.0.0.0:9122
# 如果监控一些云redis服务,通过使用rediss://架构支持SSL
rediss://azure-ssl-enabled-host.redis.cache.windows.net:6380
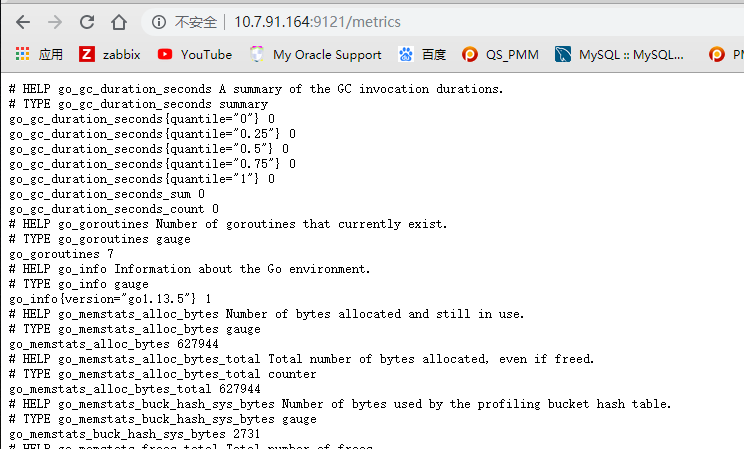
# 打开浏览器,已经可以查看监控指标了
http://10.7.91.164:9121/metrics
2 PMM Server端操作:
# redis_exporter由于没有集成到PMM服务,所以需要修改prometheus
# 进入PMM容器
docker exec -it pmm-server bin/bash
# 修改prometheus配置(容器内)
[root@a5914a0f9617 opt]# vi etc/prometheus.yml 添加以下- job_name: redis_exporter_84static_configs:- targets: ['10.5.86.84:9121']- job_name: redis_exporter_85static_configs:- targets: ['10.5.86.85:9121']- job_name: redis_exporter_86static_configs:- targets: ['10.5.86.86:9121']- job_name: redis_exporter_87static_configs:- targets: ['10.5.86.87:9121']
# 配置生效:(容器内)
curl -XPOST http://127.0.0.1:9090/prometheus/-/reload
# 或者重启pmm(容器外)
docker restart pmm-server
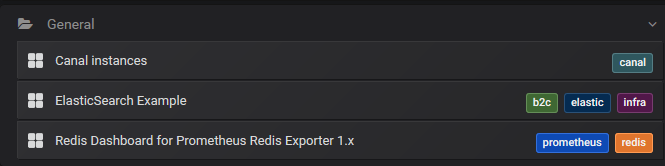
3 Grafana面板配置
# 下载 grafana 仪表盘
https://grafana.com/grafana/dashboards/763
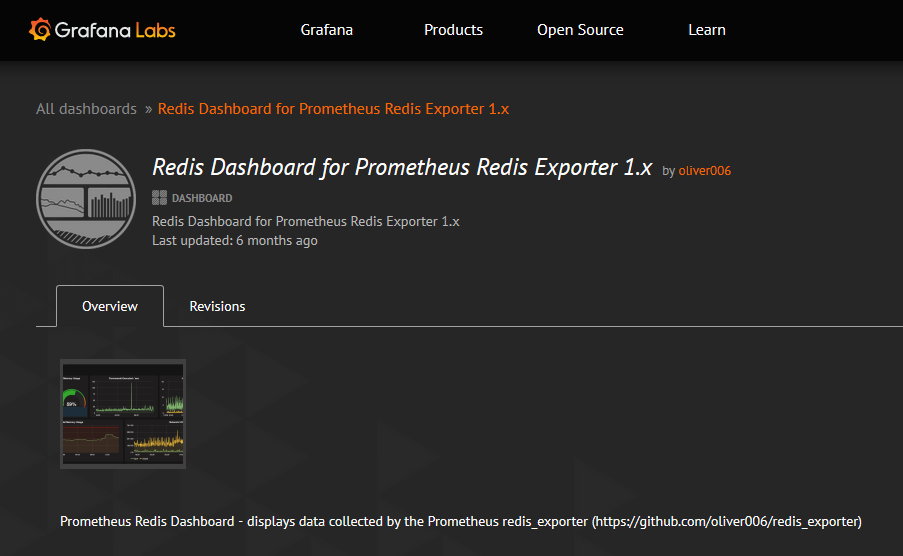
# 用这个最新的
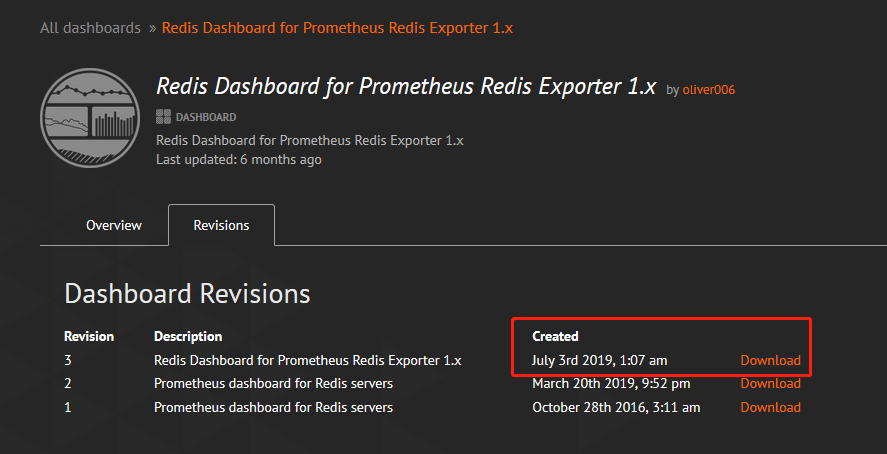
# 下载后是一个json文件
redis-dashboard-for-prometheus-redis-exporter-1-x_rev3.json
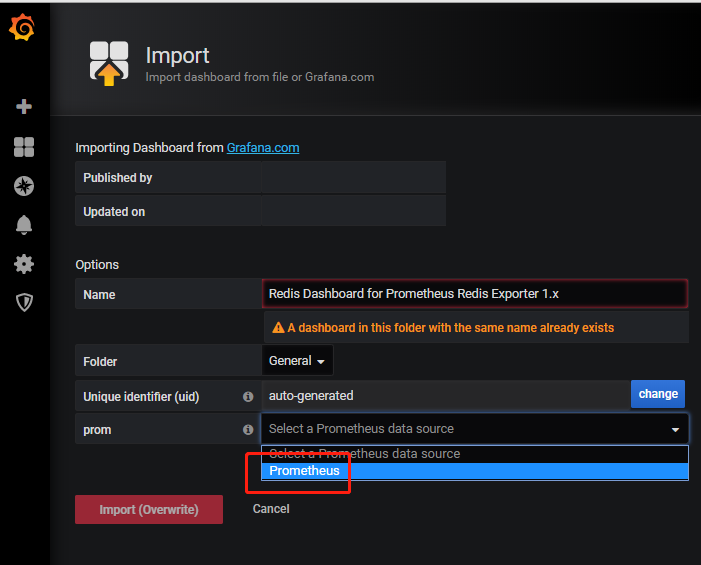
# 粘贴文件中的内容导入PMM模板:
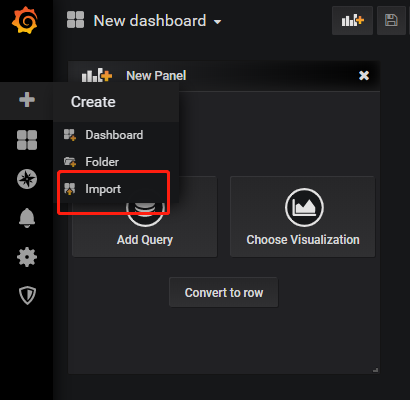
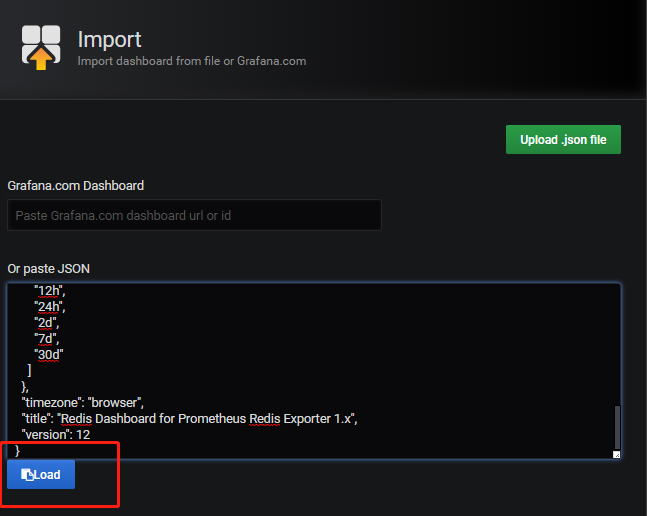
# 数据源选prometheus
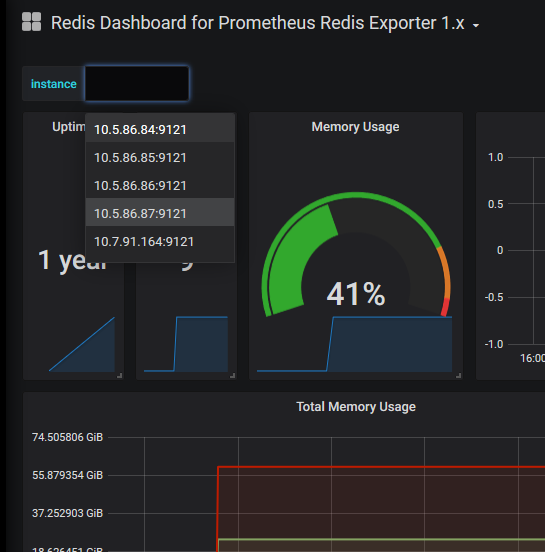
# 添加完检查几个redis都已可以监控到
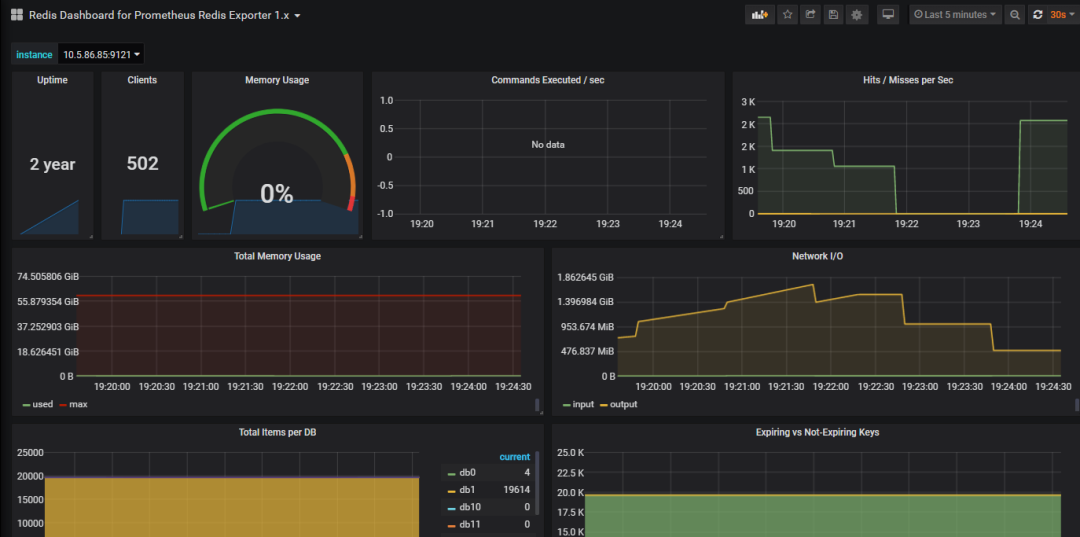
# 用自带的redis-benchmark 简单压一下
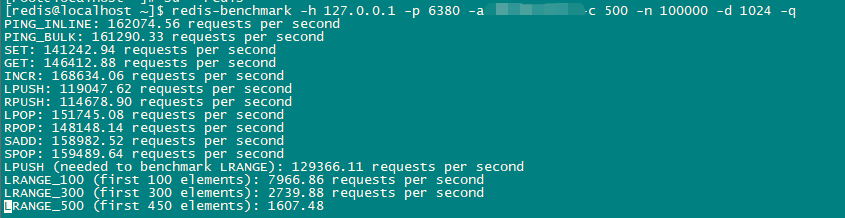
# 已可以看到变化
PMM添加ES监控
(模板作者justwatchcom)
1 被监控的ES 操作:
# 查看ES版本:
[elastic@bogon elasticsearch-7.2.0]$ curl http://localhost:9200{"name" : "bogon","cluster_name" : "elasticsearch","cluster_uuid" : "yqiuHr3GQXmYL3C7dQEkfA","version" : {"number" : "7.2.0","build_flavor" : "default","build_type" : "tar","build_hash" : "508c38a","build_date" : "2019-06-20T15:54:18.811730Z","build_snapshot" : false,"lucene_version" : "8.0.0","minimum_wire_compatibility_version" : "6.8.0","minimum_index_compatibility_version" : "6.0.0-beta1"},"tagline" : "You Know, for Search"}
# 下载安装包:
wget https://github.com/justwatchcom/elasticsearch_exporter/releases/download/v1.1.0/elasticsearch_exporter-1.1.0.linux-amd64.tar.gz
# 查看下帮助,看看参数语法
tar -zxvf elasticsearch_exporter-1.1.0.linux-amd64.tar.gzcd elasticsearch_exporter-1.1.0.linux-amd64[root@bogon elasticsearch_exporter-1.1.0.linux-amd64]# ./elasticsearch_exporter --helpusage: elasticsearch_exporter [<flags>]Flags:-h, --help Show context-sensitive help (also try --help-long and --help-man).--web.listen-address=":9114"Address to listen on for web interface and telemetry.--web.telemetry-path="/metrics"Path under which to expose metrics.--es.uri="http://localhost:9200"HTTP API address of an Elasticsearch node.--es.timeout=5s Timeout for trying to get stats from Elasticsearch.--es.all Export stats for all nodes in the cluster. If used, this flag will override the flages.node.--es.node="_local" Node's name of which metrics should be exposed.--es.indices Export stats for indices in the cluster.--es.indices_settings Export stats for settings of all indices of the cluster.--es.cluster_settings Export stats for cluster settings.--es.shards Export stats for shards in the cluster (implies --es.indices).--es.snapshots Export stats for the cluster snapshots.--es.clusterinfo.interval=5mCluster info update interval for the cluster label--es.ca="" Path to PEM file that contains trusted Certificate Authorities for the Elasticsearchconnection.--es.client-private-key=""Path to PEM file that contains the private key for client auth when connecting toElasticsearch.--es.client-cert="" Path to PEM file that contains the corresponding cert for the private key to connect toElasticsearch.--es.ssl-skip-verify Skip SSL verification when connecting to Elasticsearch.--log.level="info" Sets the loglevel. Valid levels are debug, info, warn, error--log.format="logfmt" Sets the log format. Valid formats are json and logfmt--log.output="stdout" Sets the log output. Valid outputs are stdout and stderr--version Show application version.
# 启动客户端
[root@bogon elasticsearch_exporter-1.1.0.linux-amd64]# ./elasticsearch_exporter > exporter.log 2>&1level=info ts=2020-01-03T03:16:24.081226173Z caller=clusterinfo.go:200 msg="triggering initial cluster info call"level=info ts=2020-01-03T03:16:24.081476921Z caller=clusterinfo.go:169 msg="providing consumers with updated cluster info label"level=info ts=2020-01-03T03:16:24.107876666Z caller=main.go:148 msg="started cluster info retriever" interval=5m0slevel=info ts=2020-01-03T03:16:24.108180693Z caller=main.go:188 msg="starting elasticsearch_exporter" addr=:9114
# 注意:
对于小于1.1.0rc1的版本,命令行参数 - 单个中划线开头
对于大于1.1.0rc1的版本,命令行参数 -- 两个中划线开头
# 参数说明:
--es.uri :
ES实例的地址,默认为 http://localhost:9200
格式 <proto>://<user>:<password>@<host>:<port>
例如 http://admin:pass@localhost:9200
--web.listen-address :
exporter 监控使用的IP:的端口,默认本机的9114
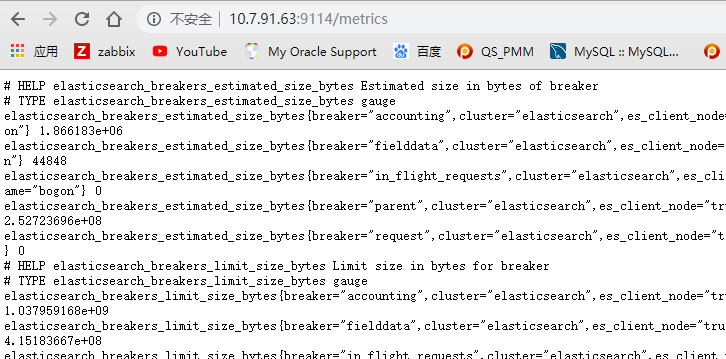
# 浏览器打开,查看监控指标,监控端口9114
http://10.7.91.63:9114/metrics
2 PMM Server端操作:
# 进入PMM容器
docker exec -it pmm-server bin/bash
# 修改 prometheus配置(容器内)
[root@a5914a0f9617 opt]# vi etc/prometheus.yml 添加以下# 采集配置- job_name: 'es-cluster'static_configs:- targets: ['10.7.91.63:9114']
# 配置生效:(容器内)
curl -XPOST http://127.0.0.1:9090/prometheus/-/reload
# 或者重启pmm(容器外)
docker restart pmm-server
3 Grafana面板配置
# 下载 grafana 仪表盘
https://github.com/justwatchcom/elasticsearch_exporter/blob/master/examples/grafana/dashboard.json
# 导入模板
和上面一样,步骤略。
# 告警规则:
https://github.com/justwatchcom/elasticsearch_exporter/blob/master/examples/prometheus/elasticsearch.rules
# 出图:
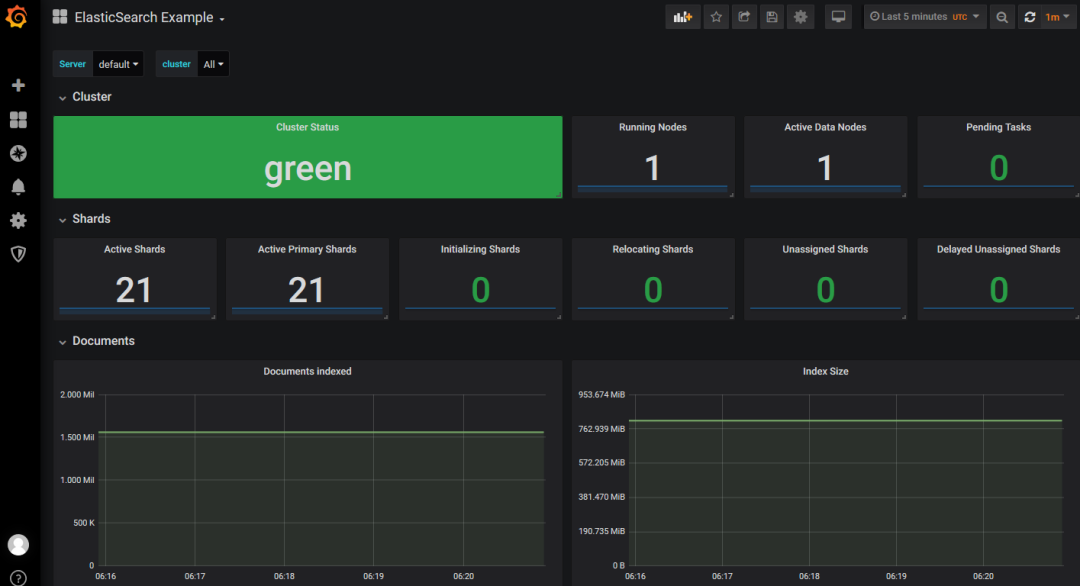
# 这样在PMM中,就又添加了2种新的资源监控,希望以后能发现更多新的玩法。