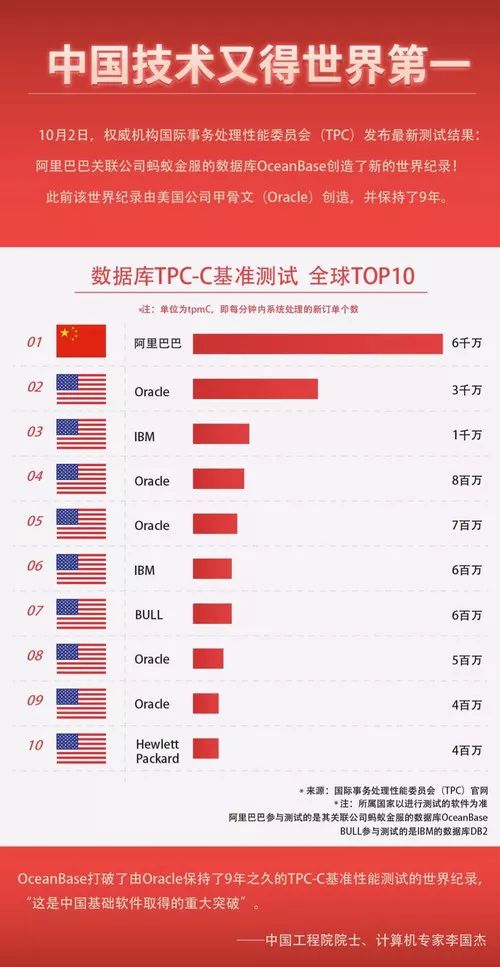
首先,也谈谈最近讨论火热的新闻:OceanBase刷新TPC-C纪录
人民日报、大红状元榜、院士站台真的是很带劲。但是数据库爱好者们对此褒贬不一,观点各异。
正方观点有:
OceanBase作为纯自主研发的数据库取得这样成绩不容易,要鼓励
分布式架构吊打集中式,可以无限扩展,集中式早过时了
第一个跑在公有云上的数据库,弹性伸缩,无需购买高昂的硬件
TPC-C是世界级标准,要求十分严格,能通过测试很厉害了
国家层面的意义:世界记录、重大突破、骄傲自豪
反方观点有:
9年前后的硬件差异太大,IPhone4对mate30
人为放大分布式架构优点,99%的企业达不到这样的级别
TPC-C是90年代的标准,很多年没人玩,认证测试员全球只剩下3个
Oracle的exadata也有公有云,性能不一定比OceanBase差
这里真替OB叫个冤,其实按行业来分阿里更应该对标亚马逊AWS,人家做个事完全是锦上添花。个人觉得打榜的更应该是达梦、人大金仓、南大之类的纯数据库研发国家队公司。
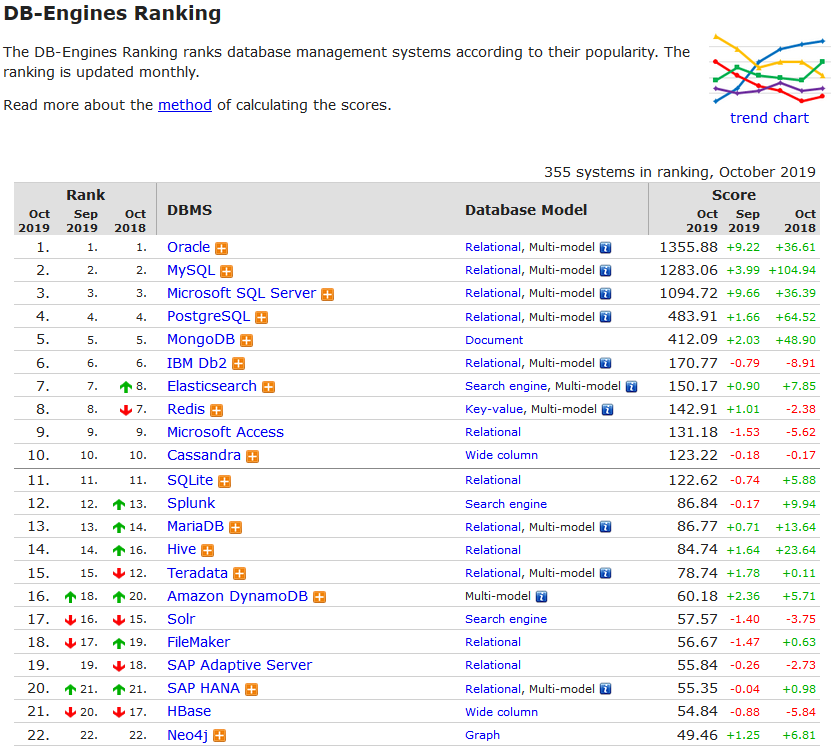
刷新TPC-C纪录肯定是个好事,说明国产数据库确实是从无到有、从有到强,是无数工程师智慧的成果。但抛开情怀,我们距离世界第一的Oracle还是有很大差距,是的,前2名依然还都是Oracle的。
真实世界:DB-Engines数据库流行度排行榜(2019年10月)
有争议说明有更多人关注OB,说明还有努力的目标,但无良媒体标题党的捧杀很可怕,这两个标题TMD能一样么?
明明是
《Jack Ma 打破了 Larry 9年前创造的世界记录》
硬说成
《Jack Ma 打破了 Larry 保持了9年的世界记录》
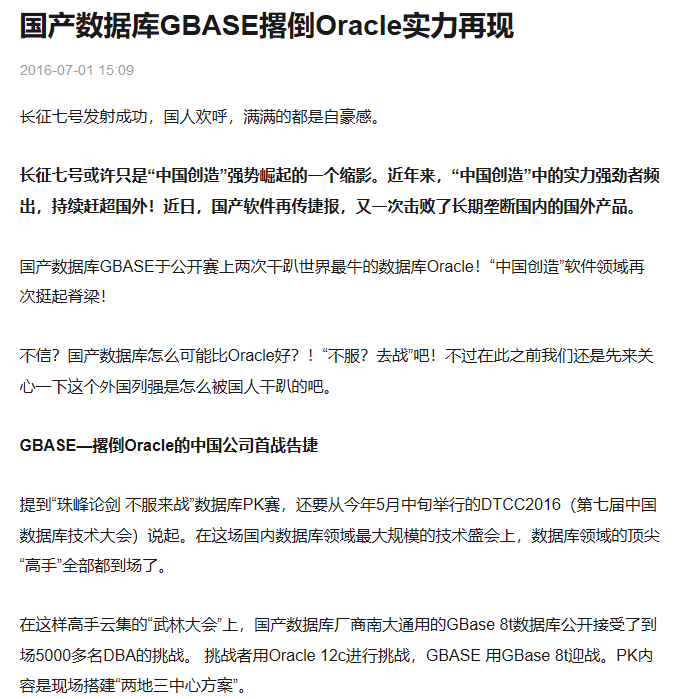
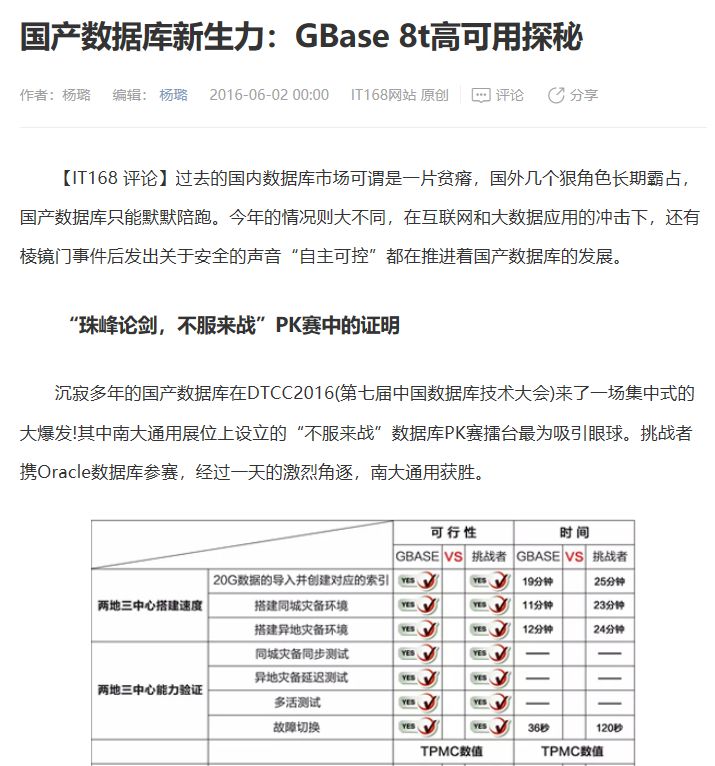
对,几年前他们就这么做的,比如这个16年被捧上天的引进(Buy)IBM Informix自主构造的GBASE...
所以看待问题要多角度,有自己的观点。辩论赛起码还有个正反两方,不要被人带节奏。

↓ 下面回到正题 ↓
Percona Monitoring and Management
是一个免费的开源平台,用于管理和监视数据库性能,在docker环境中即可运行。它可以主动管理和监控MySQL、MariaDB、MongoDB、PostgreSQL等数据库,并提供了众多指标与多样告警方式。

9月19日,官方发布了2.0的GA版本,重要的改进如下:
Our new PMM2 release introduces a number of enhancements and additional feature improvements, including:
Detailed query analytics and filtering technologies which enable you to identify issues faster than ever before.
A better user experience: Service-level dashboards give you immediate access to the data you need.
The new addition of PostgreSQL query tuning.
Enhanced security protocols to ensure your data is safe.
Our new API allows you to extend and interact with third-party tools.
紧接着10月9日,又追加更新了一版2.0.1
In this release, we are introducing the following PMM enhancements:
Securely share Dashboards with Percona – let Percona engineers see what you see!
Improved navigation – Now PMM remembers which host and service, and applies these as filters when navigating to Query Analytics
下面就开始搞起来!
1. 安装部署
PMM2没有用于老版本的升级路径,需要删除较早版本的PMM Server和Client,下载并运行最新软件。
# 1.1 PMM Server 端安装:
[root@bogon pmm-data]# docker create -v srv --name pmm-data percona/pmm-server:2 bin/trueUnable to find image 'percona/pmm-server:2' locally2: Pulling from percona/pmm-serverd8d02d457314: Pull completeb3c2227097f3: Pull completeDigest: sha256:18155d15622be47b5bf6ab4dff5dd26644a83b768b48235b099f409cfb34554bStatus: Downloaded newer image for percona/pmm-server:2c237c519977061f6f8f53cea2c96c6014a17007afdd5ac0615cb16e77c618839[root@bogon pmm-data]#[root@bogon pmm-data]# docker imagesREPOSITORY TAG IMAGE ID CREATED SIZEpercona/pmm-server 2 cd30e7343bb1 21 hours ago 1.48GBpingcap/tidb latest a8f56c299a32 2 months ago 80.2MBpingcap/tikv latest 0184005d2f99 2 months ago 361MBpingcap/tispark latest 4695b53fcfa9 2 months ago 887MBpingcap/pd latest 7b269bea9185 2 months ago 80.3MBgrafana/grafana 6.0.1 ffd9c905f698 7 months ago 241MBpercona/pmm-server latest deac61541b67 7 months ago 1.08GBhello-world latest fce289e99eb9 9 months ago 1.84kBcanal/otter-all latest e4ea8e200811 10 months ago 1.06GBpingcap/tidb-vision latest e9b25d9f7bdb 17 months ago 47.6MBprom/prometheus v2.2.1 cc866859f8df 19 months ago 113MBprom/pushgateway v0.3.1 434efa6ed9db 2 years ago 13.3MB[root@bogon pmm-data]# docker ps -aCONTAINER ID IMAGE COMMAND CREATED STATUS PORTS NAMESc237c5199770 percona/pmm-server:2 "/bin/true" 38 seconds ago Created pmm-datac536585a6b22 fce289e99eb9 "/hello" 3 months ago Exited (0) 3 months ago silly_hellman177bfcf63a43 e4ea8e200811 "/alidata/bin/main.s…" 3 months ago Exited (137) 3 months ago tender_burnell39234313a3ed e4ea8e200811 "/alidata/bin/main.s…" 3 months ago Exited (137) 3 months ago jolly_burnellfc936a843a14 canal/otter-all "/alidata/bin/main.s…" 3 months ago Exited (137) 2 months ago otter-all
由于是测试,只设置了数据保留3天,端口2019
[root@bogon pmm-data]# docker run -d -p 2019:80 -p 443:443 --volumes-from pmm-data --name pmm-server \> -e METRICS_RETENTION=48h \> --restart always percona/pmm-server:270a1cc61129a3cd369f0889ea9703c4013ecf7bcc3135c643674b955e1e8ddeb[root@bogon pmm-data]#[root@bogon pmm-data]# docker psCONTAINER ID IMAGE COMMAND CREATED STATUS PORTS NAMES70a1cc61129a percona/pmm-server:2 "/opt/entrypoint.sh" 18 seconds ago Up 17 seconds 0.0.0.0:443->443/tcp, 0.0.0.0:2019->80/tcp pmm-server[root@bogon pmm-data]# docker ps -aCONTAINER ID IMAGE COMMAND CREATED STATUS PORTS NAMES70a1cc61129a percona/pmm-server:2 "/opt/entrypoint.sh" 26 seconds ago Up 25 seconds 0.0.0.0:443->443/tcp, 0.0.0.0:2019->80/tcp pmm-serverc237c5199770 percona/pmm-server:2 "/bin/true" 2 minutes ago Created pmm-datac536585a6b22 fce289e99eb9 "/hello" 3 months ago Exited (0) 3 months ago silly_hellman177bfcf63a43 e4ea8e200811 "/alidata/bin/main.s…" 3 months ago Exited (137) 3 months ago tender_burnell39234313a3ed e4ea8e200811 "/alidata/bin/main.s…" 3 months ago Exited (137) 3 months ago jolly_burnellfc936a843a14 canal/otter-all "/alidata/bin/main.s…" 3 months ago Exited (137) 2 months ago otter-all[root@bogon pmm-data]#
通过以下地址即可访问:
http://10.7.91.63:2019

用户名:admin 密码:admin
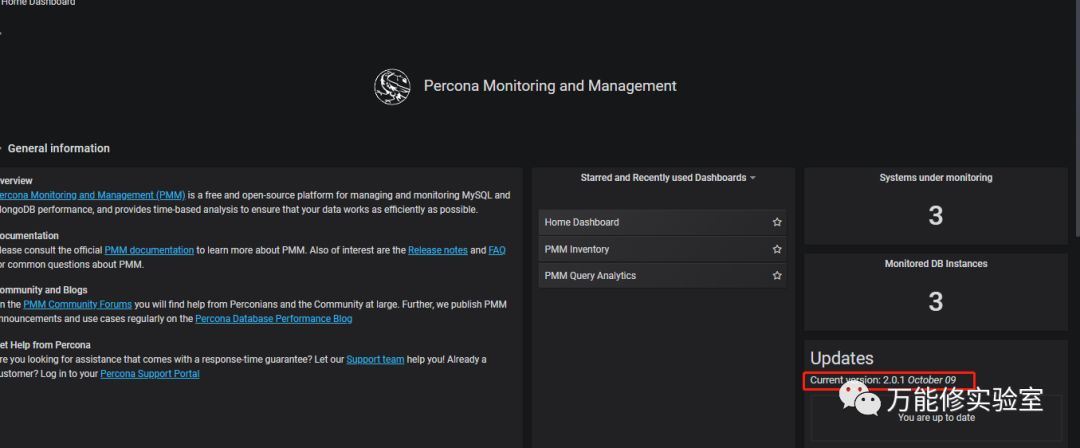
主页上确认已经是10月9日的 船新版本
# 1.2 PMM客户端安装:
地址:
https://www.percona.com/downloads/pmm2/
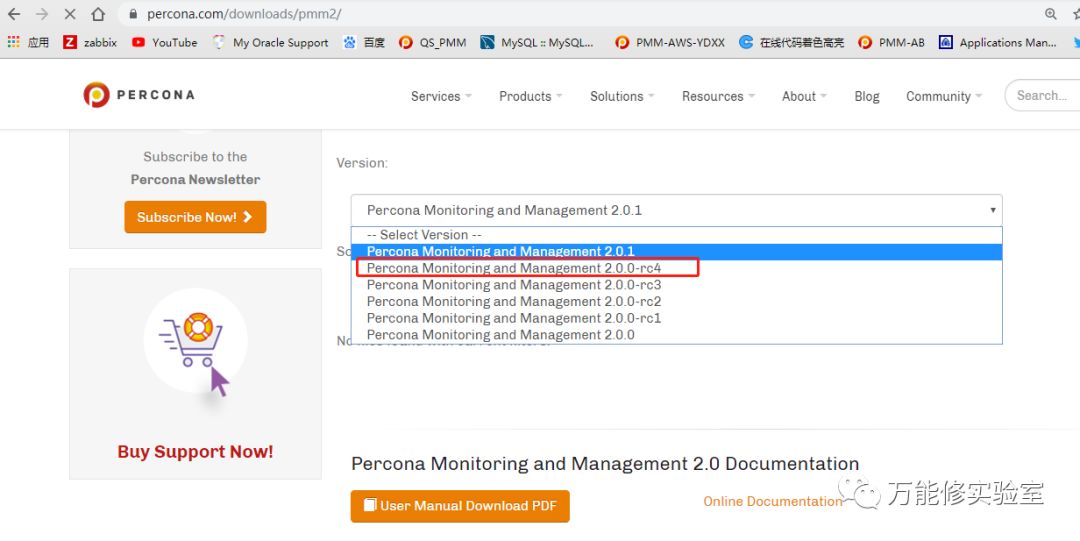
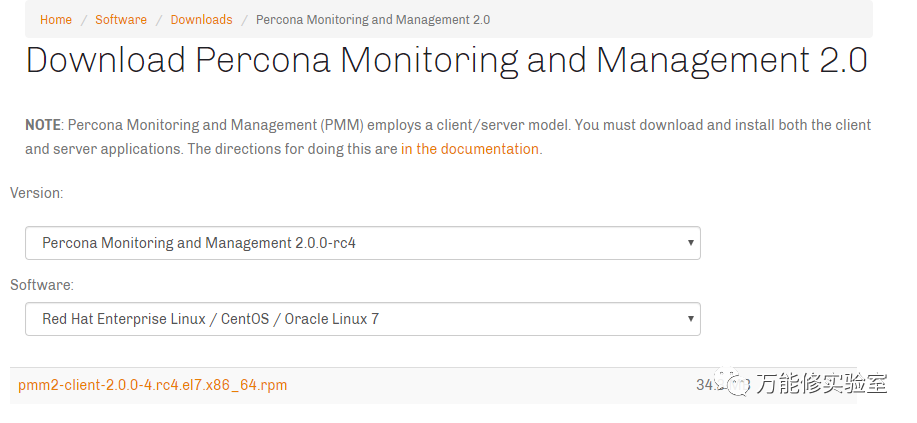
找到对应的版本地址后,直接在服务器上下载
wget https://www.percona.com/downloads/pmm2/2.0.0-rc4/binary/redhat/7/x86_64/pmm2-client-2.0.0-4.rc4.el7.x86_64.rpm
安装rpm:
[root@bogon ~]# rpm -ivh pmm2-client-2.0.0-4.rc4.el7.x86_64.rpmwarning: pmm2-client-2.0.0-4.rc4.el7.x86_64.rpm: Header V4 RSA/SHA256 Signature, key ID 8507efa5: NOKEYPreparing... ################################# [100%]Updating installing...1:pmm2-client-2.0.0-4.rc4.el7 ################################# [100%]
1.3 配置PMM客户端:
这里和以前不同,2.0使用https 443端口提高安了全性。要使用--server-url 配置server端的连接串。
[root@bogon ~]# pmm-admin config --server-insecure-tls --server-url=https://admin:admin@10.7.91.63:443Checking local pmm-agent status...pmm-agent is running.Registering pmm-agent on PMM Server...Registered.Configuration file usr/local/percona/pmm2/config/pmm-agent.yaml updated.Reloading pmm-agent configuration...Configuration reloaded.Checking local pmm-agent status...pmm-agent is running.[root@bogon ~]# pmm-admin listService type Service name Address and port Service IDAgent type Status Agent ID Service IDpmm-agent connected agent_id/6f02c6e5-661a-4052-9dd6-811a9364b3dfnode_exporter running agent_id/9c99b1b3-fe17-4210-9a28-2bd9425a8923
2. 添加监控项
PMM2.0的pmm-admin命令和1.X版本有很大不同,很多参数都已经修改。2.0的各种指标对应参数相对来说更加统一,对比下:
# pmm 2.X 命令:pmm-admin config --server-insecure-tls --server-url=https://admin:***@10.7.91.63:443pmm-admin add mysql --query-source=perfschema --username=root --password=***address=10.7.70.186:3306pmm-admin add mongodb --username=super --password=*** address=127.0.0.1:27017/adminpmm-admin add proxysql --username=admin --password=*** name=proxysql-test# 对应在pmm 1.X 命令:pmm-admin config --server 10.7.91.63:2019 --server-user caihao --server-password caihao --client-name Test1pmm-admin add mysql --user=root --password=*** --host=10.7.70.187 --port=3306 --query-source perfschemapmm-admin add mongodb --uri mongodb://super:***@127.0.0.1:27017/adminpmm-admin add proxysql --dsn "admin:***@tcp(localhost:6032)/"
实际执行效果:
# 添加MySQL监控
(pmm-admin add mysql --help 看下命令)
[root@bogon ~]# pmm-admin add mysql --query-source=perfschema --username=root --password=XXX address=10.7.70.186:3306MySQL Service added.Service ID : service_id/dadfaca7-428b-4646-9680-836195255c51Service name: address=10.7.70.186:3306[root@bogon ~]# pmm-admin listService type Service name Address and port Service IDMySQL address=10.7.70.186:3306 127.0.0.1:3306 service_id/dadfaca7-428b-4646-9680-836195255c51Agent type Status Agent ID Service IDpmm-agent connected agent_id/6f02c6e5-661a-4052-9dd6-811a9364b3dfnode_exporter running agent_id/9c99b1b3-fe17-4210-9a28-2bd9425a8923mysqld_exporter running agent_id/f249b307-1dcd-46e3-897e-164c06202f96 service_id/dadfaca7-428b-4646-9680-836195255c51qan-mysql-perfschema-agent running agent_id/f2ae7760-a09e-4bc6-9e28-bed9bd525da5 service_id/dadfaca7-428b-4646-9680-836195255c51
# 添加MongoDB监控
(pmm-admin add mongodb --help 看下命令)
[root@bogon ~]# pmm-admin add mongodb --username=super --password=*** address=127.0.0.1:27017/adminMongoDB Service added.Service ID : service_id/4cfa09b1-44bc-4ab6-b359-b1774e14ca6fService name: address=127.0.0.1:27017/admin[root@bogon ~]# pmm-admin listService type Service name Address and port Service IDMySQL address=10.7.70.186:3306 127.0.0.1:3306 service_id/dadfaca7-428b-4646-9680-836195255c51MongoDB address=127.0.0.1:27017/admin 127.0.0.1:27017 service_id/4cfa09b1-44bc-4ab6-b359-b1774e14ca6fAgent type Status Agent ID Service IDpmm-agent connected agent_id/6f02c6e5-661a-4052-9dd6-811a9364b3dfnode_exporter running agent_id/9c99b1b3-fe17-4210-9a28-2bd9425a8923mysqld_exporter running agent_id/f249b307-1dcd-46e3-897e-164c06202f96 service_id/dadfaca7-428b-4646-9680-836195255c51qan-mysql-perfschema-agent running agent_id/f2ae7760-a09e-4bc6-9e28-bed9bd525da5 service_id/dadfaca7-428b-4646-9680-836195255c51mongodb_exporter running agent_id/82316ef1-2801-4a7b-a0ef-14222454ae53 service_id/4cfa09b1-44bc-4ab6-b359-b1774e14ca6fqan-mongodb-profiler-agent running agent_id/f474eb33-2e40-4ed5-b561-930d38bbea70 service_id/4cfa09b1-44bc-4ab6-b359-b1774e14ca6f
# 添加PostgreSQL监控
(pmm-admin add postgresql --help 看下命令)
手头没有PG,没测。
# 添加ProxySQL 监控
(pmm-admin add proxysql --help 看下命令)
[root@zabbix ~]# pmm-admin add proxysql --username=admin --password=*** name=proxysql-testProxySQL Service added.Service ID : /service_id/04bfffc5-ba00-4ec2-aa3a-289e8df1a603Service name: name=proxysql-test[root@zabbix ~]# pmm-admin listService type Service name Address and port Service IDProxySQL name=proxysql-test 127.0.0.1:6032 /service_id/04bfffc5-ba00-4ec2-aa3a-289e8df1a603Agent type Status Agent ID Service IDpmm-agent connected /agent_id/7eacb070-b5aa-4166-ab2d-f0140ae77f3dnode_exporter running /agent_id/5d24c816-6e9c-4492-ae71-55bb24b5f029proxysql_exporter running /agent_id/08646405-2c33-476c-920f-2d5f94e1b4ed /service_id/04bfffc5-ba00-4ec2-aa3a-289e8df1a603
3. 新功能效果
# 新的菜单分类,更简洁。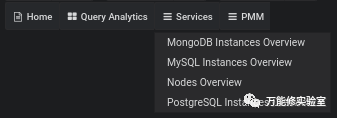
# 每个点下去逐级细化,更有层次感。
# PMM Inventory:
新的PMM Inventory能够更直观的展示各种对象。采用了新的模型,PMM可见的所有对象都是节点,服务或代理。这三种类型对象具有层次结构,“节点”位于顶部,然后将“服务”和“代理”分配给“节点”。
三个选项:Service,Agents和Nodes
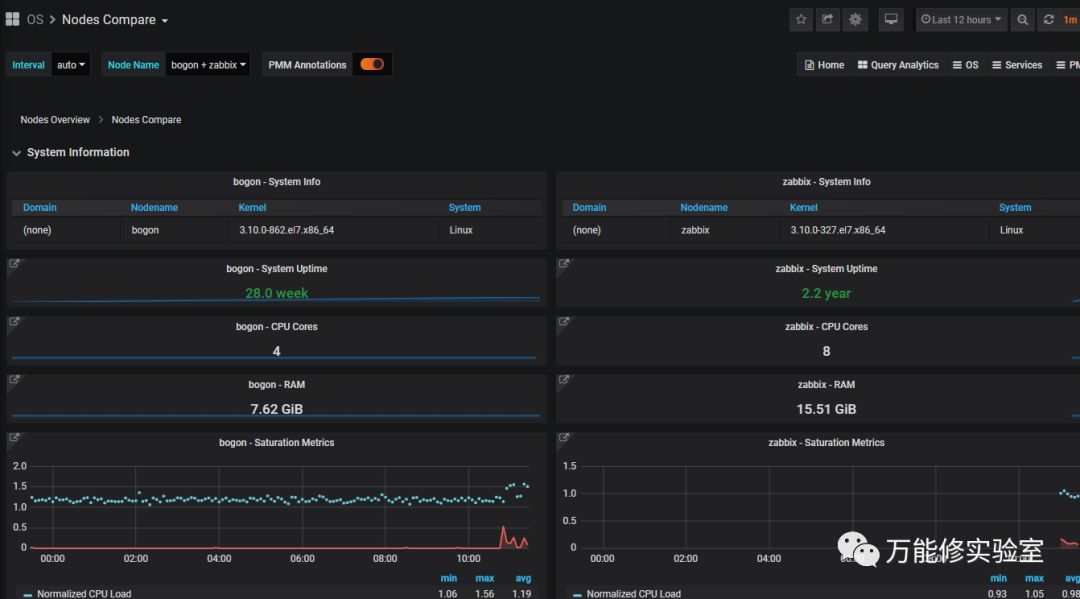
# Compare功能
可以对比几个对象的各种指标,一目了然。
# API
可以和配置管理工具,如Ansible,Chef和Puppet结合,通过命令行或者程序对监控对象进行批量的查看、删除、修改等操作。
测试下使用API查看当前所有节点信息:
[root @bogon~]# curl -k -u admin:*** -X POST "https://10.7.91.63/v1/inventory/Nodes/List"{"generic": [{"node_id": "/node_id/07254981-7d98-4afa-a3a1-17aeb909202f","node_name": "bogon","address": "10.7.70.186","machine_id": "/machine_id/410954788ad2485c948fca2d7cabce31","distro": "linux"}, {"node_id": "/node_id/9346c1a8-6f1d-4ff5-896f-46a569e85a9e","node_name": "zabbix","address": "10.7.70.49","machine_id": "/machine_id/2930e4d06bf0417787b1271145cce47a","distro": "linux"}, {"node_id": "pmm-server","node_name": "pmm-server","address": "127.0.0.1"}]}[root @bogon~]#
4. 总结
经过简单测试,可以看到PMM2.X版本功能有所增强,易用度提升,整体变化还是很大的:
更安全、界面更屌。--没啥大用
慢查询分析器更细致了。--好
对PG支持的更好了。。--没测
可以共享面板给percona官方人员,估计以后可以发布一些有特色的用户自定义模板,给大家参考。。--暂时还没啥用
提供API接口,允许其他应用调用。--好
加入指标对比功能 --好
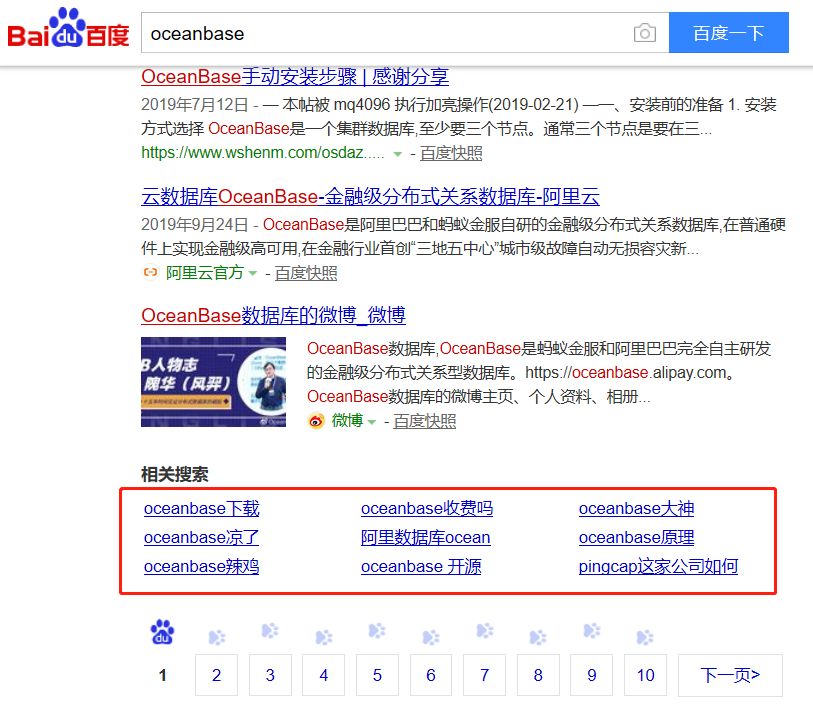
最后BS下百度,闲的没事的小伙伴可以试试搜其他数据库看最下。