


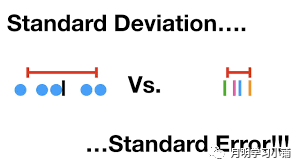
01 标准差 标准误基本概念介绍
02 非复杂抽样设计
我们平时看到的很多研究其实都不是复杂抽样设计(a complex, multistage probability sampling design),要不然用NHANES数据发表的文章也不会把全国性代表性样本(the large nationally representative sample)放在优势的第一个。
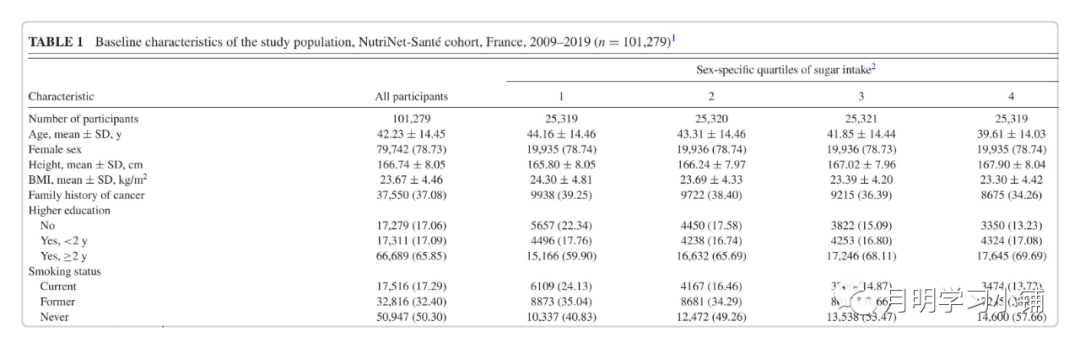
以基于法国NutriNet-Santé队列研究发表文章为例,摘取其中的Table 1及方法结果描述。
↑
非复杂抽样设计Table1
Baseline characteristics of the study population were examined across sex-specific quartiles of sugar intake and were compared using ANOVA tests for continuous variables or χ2 tests for categorical variables.
Mean ± SD daily intake of sugars was 92.8 ± 33.2 g. Mean contribution of sugars to energy intake was 19.6% (19.9% in women and 18.3% in men)
03 NHANES文章使用标准差
Continuous variables are presented as mean ± standard deviation, median, and interquartile range (IQR), and categorical variables are presented as percentages.
The final study population had a mean age of 48 (SD 19) years; 50.1% were males.
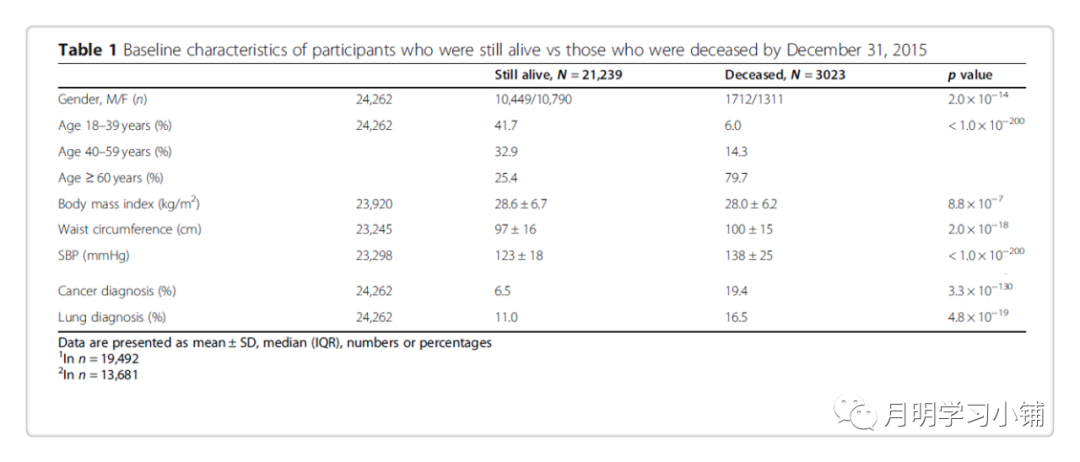
04 NHANES文章使用标准误

Means and proportions of baseline characteristics were compared by using linear regression analyses for continuous variables and logistic regression analyses for categorical variables.
This cohort study of 2116 adults aged 20 years and older comprised 1145 women (weighted proportion, 51.6%) and 971 men (weighted, 48.4%),with a weighted mean(SE) age of 42.6 (0.5) years; 958 participants (weighted, 68.4%) were of non-Hispanic white ancestry.

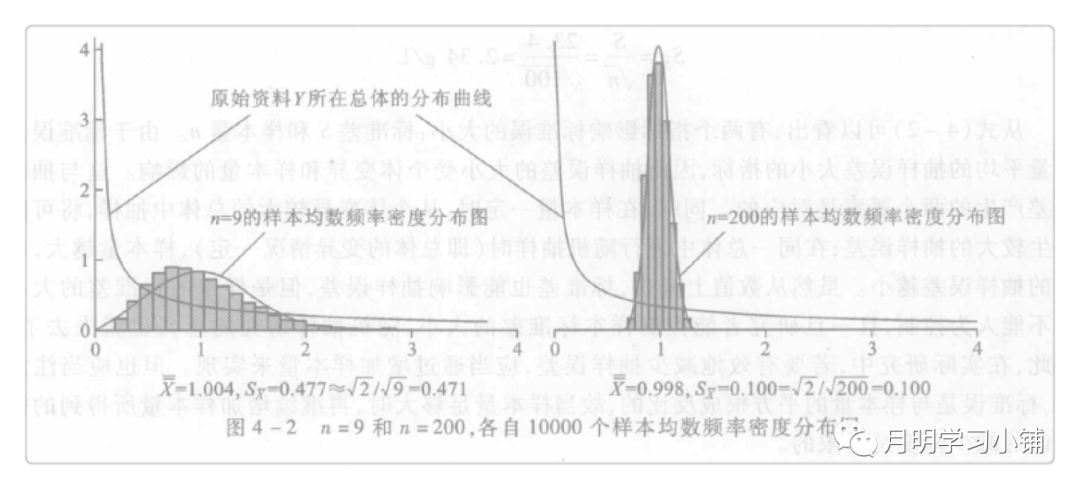
05 一点总结
06 参考内容
https://www.zhihu.com/question/22864111
Debras C, Chazelas E, Srour B, et al. Total and added sugar intakes, sugar types, and cancer risk: results from the prospective NutriNet-Sante cohort. Am J Clin Nutr. 2020;112(5):1267-1279.
Wolffenbuttel BHR, Heiner-Fokkema MR, Green R, Gans ROB. Relationship between serum B12 concentrations and mortality: experience in NHANES. BMC Med. 2020;18(1):307.
Yang Q, Zhang Z, Gregg EW, Flanders WD, Merritt R, Hu FB. Added sugar intake and cardiovascular diseases mortality among US adults. JAMA Intern Med. 2014;174(4):516-524.
赵耐青老师的《卫生统计学》
文章转载自月明学习小铺,如果涉嫌侵权,请发送邮件至:contact@modb.pro进行举报,并提供相关证据,一经查实,墨天轮将立刻删除相关内容。
