


import pandas as pd
customer = pd.read_csv("Churn_Modelling.csv")marketing = pd.read_csv("DirectMarketing.csv")
customer[['Geography','Gender','EstimatedSalary']].groupby(['Geography','Gender']).mean()
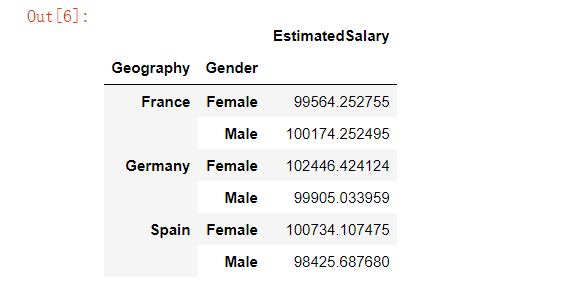
从上面的结果可以得知,在“法国”这一类当中的“女性(Female)”这一类的预估工资的平均值达到了99564欧元,“男性”达到了100174欧元
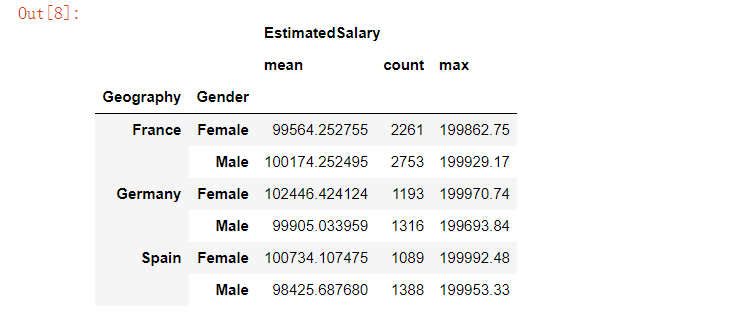
customer[['Geography','Gender','EstimatedSalary']].groupby(['Geography','Gender']).agg(['mean','count','max'])
customer[['Geography','EstimatedSalary','Balance']].groupby('Geography').agg({'EstimatedSalary':'sum', 'Balance':'mean'})

pd.crosstab(index=marketing.Age, columns=marketing.Gender, values=marketing.Salary, aggfunc='mean').round(1)

pd.crosstab(index=[marketing.Age, marketing.Married], columns=marketing.Gender,values=marketing.Salary, aggfunc='mean', margins=True).round(1)
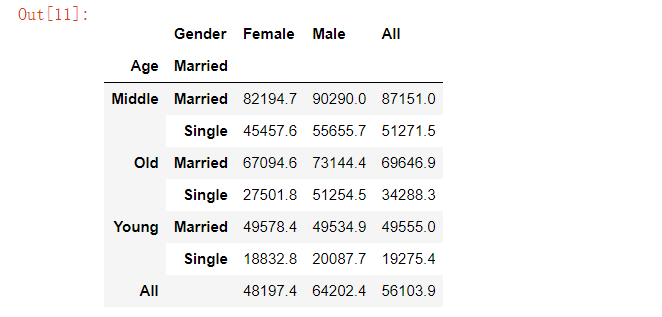
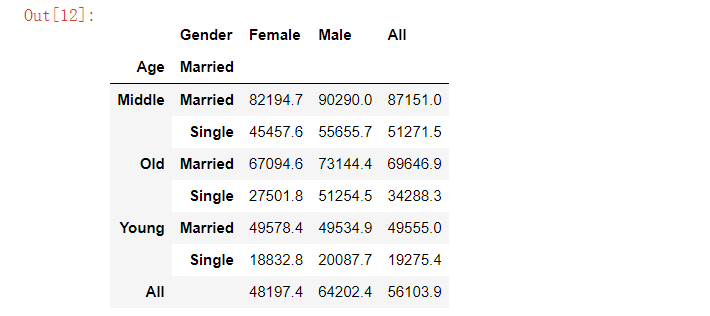
pd.pivot_table(data=marketing, index=['Age', 'Married'], columns='Gender', values='Salary', aggfunc='mean', margins=True).round(1)
pip install sidetable
import sidetablemarketing.stb.freq(['Age'])

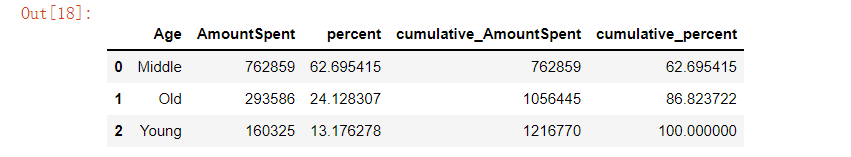
marketing.stb.freq(['Age'], value='AmountSpent')
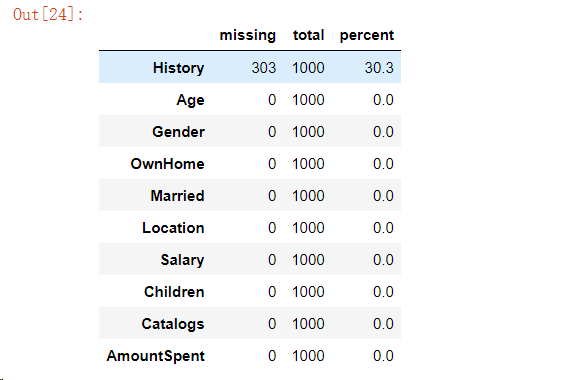
“Sidetable”函数当中的“Missing”方法顾名思义就是返回缺失值的数量以及百分比,例如下面的代码,“History”这一列的缺失值占到了30.3%
marketing.stb.missing()
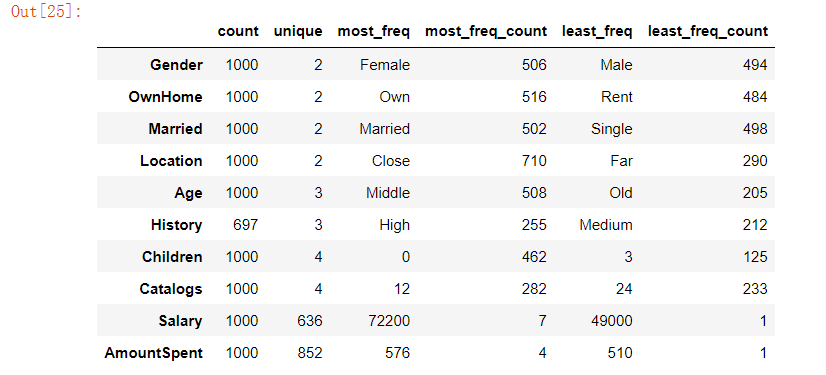
marketing.stb.counts()


文章转载自关于数据分析与可视化,如果涉嫌侵权,请发送邮件至:contact@modb.pro进行举报,并提供相关证据,一经查实,墨天轮将立刻删除相关内容。
