


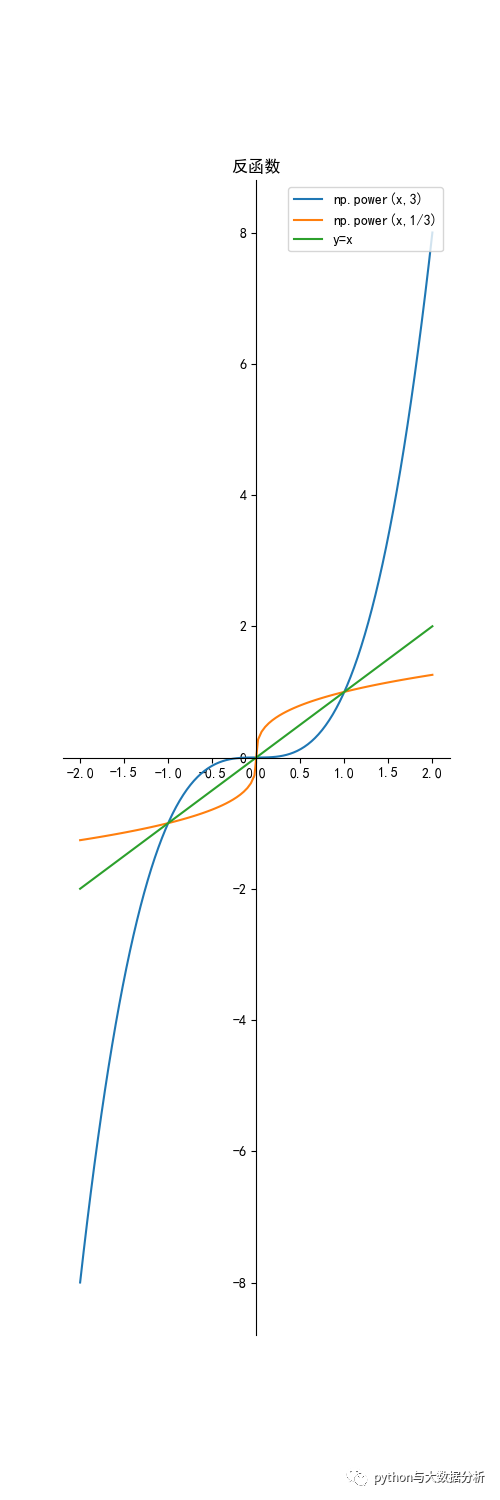
一般来说,设函数y=f(x)(x∈A)的值域是C,若找得到一个函数g(y)在每一处g(y)都等于x,这样的函数x= g(y)(y∈C)叫做函数y=f(x)(x∈A)的反函数,记作x=f-1(y) 。反函数x=f -1(y)的定义域、值域分别是函数y=f(x)的值域、定义域。最具有代表性的反函数就是对数函数与指数函数。
#!/usr/bin/env python# -*- coding: UTF-8 -*-# _ooOoo_# o8888888o# 88" . "88# ( | - _ - | )# O\ = O# ____/`---'\____# .' \\| |// `.# \\|||:|||// \# _|||||-:- |||||- \# | | \\\ - | |# | \_| ''\---/'' | _/ |# \ .-\__ `-` ___/-. # ___`. .' --.--\ `. . __# ."" '< `.___\_<|>_/___.' >'"".# | | : `- \`.;`\ _ `;.`/ - ` : | |# \ \ `-. \_ __\ __ _/ .-` # ==`-.____`-.___\_____/___.-`____.-'==# `=---=''''@Project :pythonalgorithms @File :Inversefunction.py@Author :不胜人生一场醉@Date :2021/7/29 23:17 '''import matplotlib.pyplot as pltimport numpy as npif __name__ == '__main__': inversefunction()
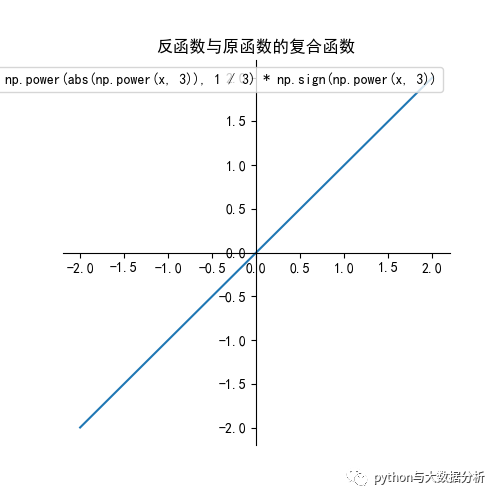
def inversefunction():   plt.figure(figsize=(5, 15))   ax = plt.gca()  # 通过gca:get current axis得到当前轴   plt.rcParams['font.sans-serif'] = ['SimHei']  # 绘图中文   plt.rcParams['axes.unicode_minus'] = False  # 绘图负号   x = np.linspace(-2, 2, 100)   y1 = np.power(x, 3)   y2 = np.power(abs(x), 1 / 3) * np.sign(x)   y3 = x   label = 'np.power(x,3)'   plt.plot(x, y1, label=label)   label = 'np.power(x,1/3)'   plt.plot(x, y2, label=label)   # plt.plot(y1,x,label=label)   # np.power(x,1/3)和x,y1调换一下是等价的   label = 'y=x'   plt.plot(x, y3, label=label)   # 设置图片的右边框和上边框为不显示   ax.spines['right'].set_color('none')   ax.spines['top'].set_color('none')   # 挪动x,y轴的位置,也就是图片下边框和左边框的位置   # data表示通过值来设置x轴的位置,将x轴绑定在y=0的位置   ax.spines['bottom'].set_position(('data', 0))   # axes表示以百分比的形式设置轴的位置,即将y轴绑定在x轴50%的位置   # ax.spines['left'].set_position(('axes', 0.5))   ax.spines['left'].set_position(('data', 0))   plt.title("反函数")   plt.legend(loc='upper right')   plt.show()   # 反函数与原函数的复合函数等于x   plt.figure(figsize=(5, 5))   ax = plt.gca()  # 通过gca:get current axis得到当前轴   plt.rcParams['font.sans-serif'] = ['SimHei']  # 绘图中文   plt.rcParams['axes.unicode_minus'] = False  # 绘图负号   x = np.linspace(-2, 2, 100)   y1 = np.power(x, 3)   y2 = np.power(abs(y1), 1 / 3) * np.sign(y1)   label = 'np.power(abs(np.power(x, 3)), 1  3) * np.sign(np.power(x, 3))'   plt.plot(x, y2, label=label)
   ax.spines['right'].set_color('none')
   ax.spines['top'].set_color('none')

   # 挪动x,y轴的位置,也就是图片下边框和左边框的位置
   # data表示通过值来设置x轴的位置,将x轴绑定在y=0的位置
   ax.spines['bottom'].set_position(('data', 0))
   # axes表示以百分比的形式设置轴的位置,即将y轴绑定在x轴50%的位置
   # ax.spines['left'].set_position(('axes', 0.5))
   ax.spines['left'].set_position(('data', 0))
   plt.title("反函数与原函数的复合函数")
   plt.legend(loc='upper right')
   plt.show()
原创不易,转载请注明!请多多关注,谢谢!

文章转载自追梦IT人,如果涉嫌侵权,请发送邮件至:contact@modb.pro进行举报,并提供相关证据,一经查实,墨天轮将立刻删除相关内容。
