


故障描述:
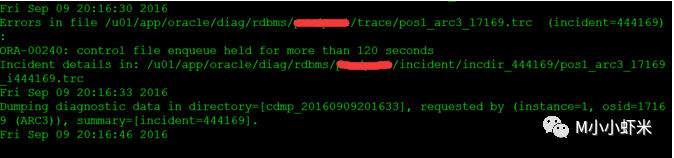
ORA-00240: 控制文件入队被持有的时间超过了 120 秒
查看相应trace文件:
Dump continued from file: u01/app/oracle/diag/rdbms/pos/pos1/trace/pos1_arc3_17169.trc
ORA-00240: control file enqueue held for more than 120 seconds
========= Dump for incident 444169 (ORA 240) ========
----- Beginning of Customized Incident Dump(s) -----
-------------------------------------------------------------------------------
CONTROL FILE ENQUEUE HELD FOR TOO LONG
holding mode : S
enqueue holder : 'inst 1, osid 17169'
enqueue held time : 120 seconds
The current process 'inst 1, osid 17169' holds the control file enqueue
for more than 120 seconds.
Oracle Support Services triaging information: to find the root-cause, look
at the call stack of this process 'inst 1, osid 17169' below and ask
the developer that owns the first NON-service layer in the stack above
ksu_dispatch_tac to investigate. Common service layers are enqueues (ksq),
latches (ksl) library cache pins and locks (kgl), and row cache locks (kqr).
Internal debug info:
type : 0
acquired at : FILE kcrr.c, LINE 3594
Dump of the process state:
----- Call Stack Trace -----
calling call entry argument values in hex
location type point (? means dubious value)
-------------------- -------- -------------------- ----------------------------
skdstdst()+41 call kgdsdst() 7FFF1B377198 ? 000000000 ?
000000000 ? 000000001 ?
7FFF1B37BB30 ? 000000000 ?
ksedst1()+103 call skdstdst() 7FFF1B377198 ? 000000000 ?
000000000 ? 000000001 ?
7FFF1B37BB30 ? 000000000 ?
kcc_tac_callback()+ call ksedst1() 7FFF1B377198 ? 000000000 ?
1552 000000000 ? 000000001 ?
7FFF1B37BB30 ? 000000000 ?
ksu_dispatch_tac()+ call kcc_tac_callback() 7FFF1B377198 ? 000000000 ?
1591 000000000 ? 000000001 ?
7FFF1B37BB30 ? 000000000 ?
*****
call stack performance statistics:
total : 0.120000 sec
setup : 0.000000 sec
stack unwind : 0.010000 sec
symbol translation : 0.100000 sec
printing the call stack: 0.010000 sec
printing frame data : 0.000000 sec
printing argument data : 0.000000 sec
----- End of Call Stack Trace -----
Current Wait Stack:
1: waiting for 'KSV master wait'
=0x0, =0x0, =0x0
wait_id=22622 seq_num=23614 snap_id=1
wait times: snap=18.322308 sec, exc=18.322308 sec, total=18.322308 sec
wait times: max=infinite, heur=18.322308 sec
wait counts: calls=6 os=6
in_wait=1 iflags=0x1520
0: waiting for 'Disk file operations I/O'
FileOperation=0x2, fileno=0x0, filetype=0x3
wait_id=22620 seq_num=23613 snap_id=2
wait times: snap=0.000000 sec, exc=0.000292 sec, total=2 min 3 sec
wait times: max=infinite, heur=2 min 3 sec
wait counts: calls=0 os=0
in_wait=1 iflags=0x15a0
There are 1 sessions blocked by this session.
Dumping one waiter:
inst: 2, sid: 1787, ser: 3
wait event: 'enq: CF - contention'
p1: 'name|mode'=0x43460005
p2: '0'=0x0
p3: 'operation'=0x0
row_wait_obj#: 4294967295, block#: 0, row#: 0, file# 0
min_blocked_time: 70 secs, waiter_cache_ver: 26577
Wait State:
fixed_waits=0 flags=0x22 boundary=(nil)/-1
Session Wait History:
elapsed time of 0.000000 sec since current wait
0: waited for 'Disk file operations I/O'
FileOperation=0x2, fileno=0x0, filetype=0x3
wait_id=22620 seq_num=23613 snap_id=2
wait times: snap=0.000196 sec, exc=0.000292 sec, total=1 min 45 sec
wait times: max=infinite
wait counts: calls=0 os=0
occurred after 0.000000 sec of elapsed time
1: waited for 'latch free'
篇幅有限,不全部粘贴内容,只标识出红色关键信息,从MOS查询匹配到标红字体内容再结合环境版本11.2.0.3可知这是一个已知BUG。
[BUG ID 1308282.1]:
Cause
Event 'KSV master wait' indicates the process on the RDBMS side is waiting for a reply from a process on the ASM side. In 11g, the parameter cell_offload_processing is set to TRUE. Although that is a parameter is not applicable for non-Exadata databases, it caused ASM to try to deliver smart-scan results. The issue was reported in Bug 11800170 - ASM IN KSV WAIT AFTER APPLICATION OF 11.2.0.2 GRID PSU.
Solution
The following solutions are available for non-Exadata databases:
1.For the quickest solution, use the workaround. The workaround does not negatively impact non-Exadata databases.
alter system set cell_offload_processing = false;
2.Upgrade to 12.1, when available.
3.Apply the 11.2.0.3 patch set
4.Apply one-off Patch 11800170, if available for your RDBMS and Grid Homes
本案例通过修改参数并重启后问题得以解决。
