


zabbix+grafana可视化界面配置大屏.docx
10墨值下载
· 下载地址
https://grafana.com/grafana/download/10.0.0?pg=oss-graf&plcmt=hero-btn-1&platform=lin
ux
wget https://dl.grafana.com/enterprise/release/grafana-enterprise-10.0.0-1.x86_64.rpm
[root@pg211 opt]# yum -y localinstall grafana-enterprise-10.0.0-1.x86_64.rpm
· 启动服务并设置开机启动
[root@pg211 opt]# systemctl start grafana-server.service
[root@pg211 opt]# systemctl enable grafana-server.service
· 检查程序端口
[root@pg211 opt]# netstat -nltp|grep grafana
tcp6 0 0 :::3000 :::* LISTEN 8651/grafana
修改网页中文显示
[root@pg211 conf]# pwd
/usr/share/grafana/conf
[root@pg211 conf]# cat defaults.ini |grep default_language
default_language = zh-Hans
· 登录网页
http://192.168.31.211:3000/login
用户:admin
密码:admin
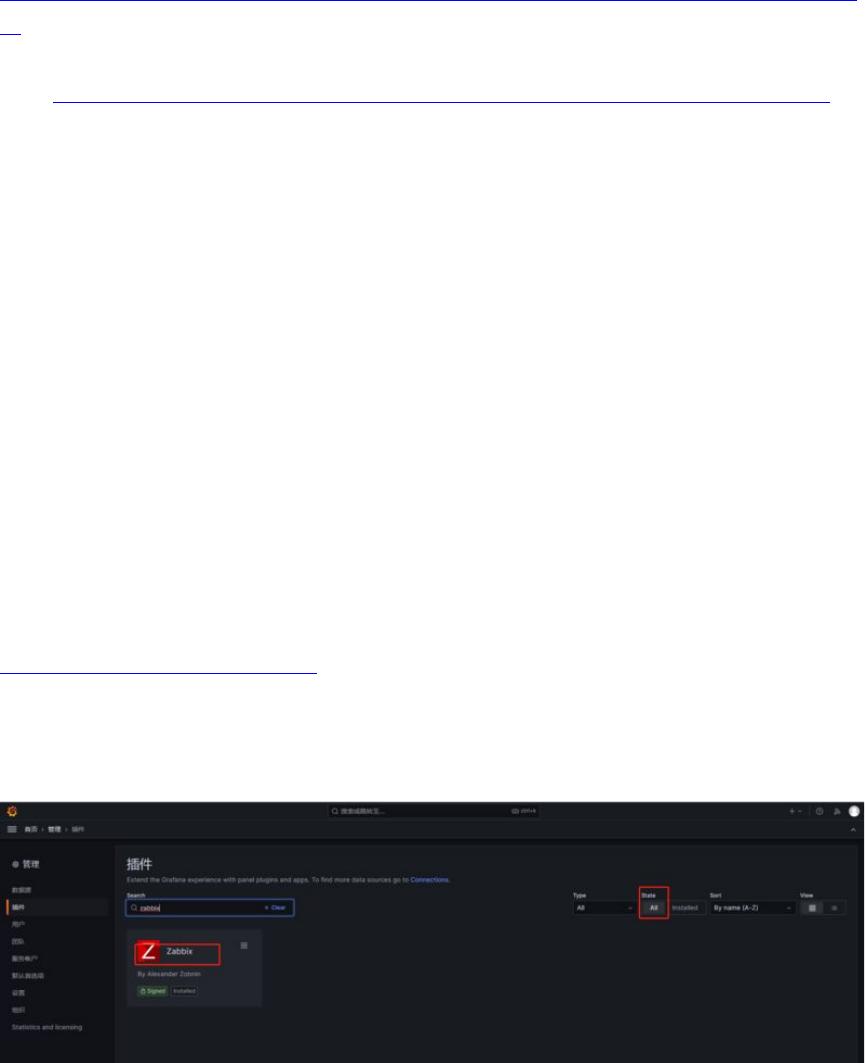
· 安装 zabbix 插件
开启插件:
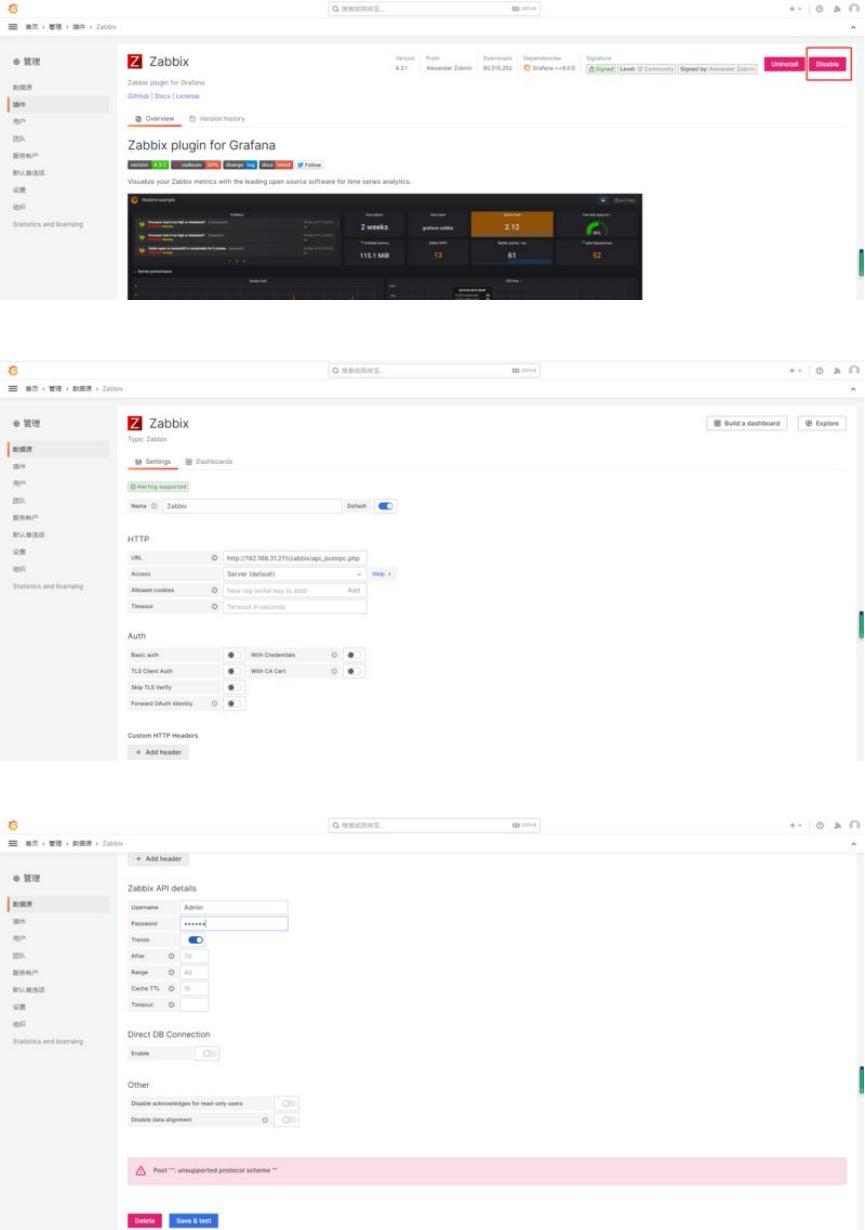
添加设置数据源:
http://192.168.31.211/zabbix/api_jsonrpc.php
用户密码为 zabbix 网站的登录用户密码:Admin/zabbix
of 2
10墨值下载
【版权声明】本文为墨天轮用户原创内容,转载时必须标注文档的来源(墨天轮),文档链接,文档作者等基本信息,否则作者和墨天轮有权追究责任。如果您发现墨天轮中有涉嫌抄袭或者侵权的内容,欢迎发送邮件至:contact@modb.pro进行举报,并提供相关证据,一经查实,墨天轮将立刻删除相关内容。
下载排行榜

评论