


IEEE VIS 2021_Natural Language to Visualization by Neural Machine Translation_华为.pdf
免费下载
Natural Language to Visualization by Neural Machine Translation
Yuyu Luo, Nan Tang, Guoliang Li*, Jiawei Tang, Chengliang Chai, Xuedi Qin
2021-03-08
2021-03-08
2021-03-08
2021-03-08
California
California
New York
New York
confirmed
deaths
confirmed
deaths
3599250
54220
1694651
48335
date states
cases
number
D
N1
C
Create a bar chart showing the top 5
states with the most confirmed cases
until 2021-03-08
Show me the trend of confirmed,
died, and recovered cases in Utah
N1, D
N2, C, D
A
B
ncNet
A Transformer-based
sequence-to-sequence
neural translation model
Convert to
Vega-Lite
Encoder Decoder
N2
h
Visualization by NL query
N2
Visualization by NL query
N1
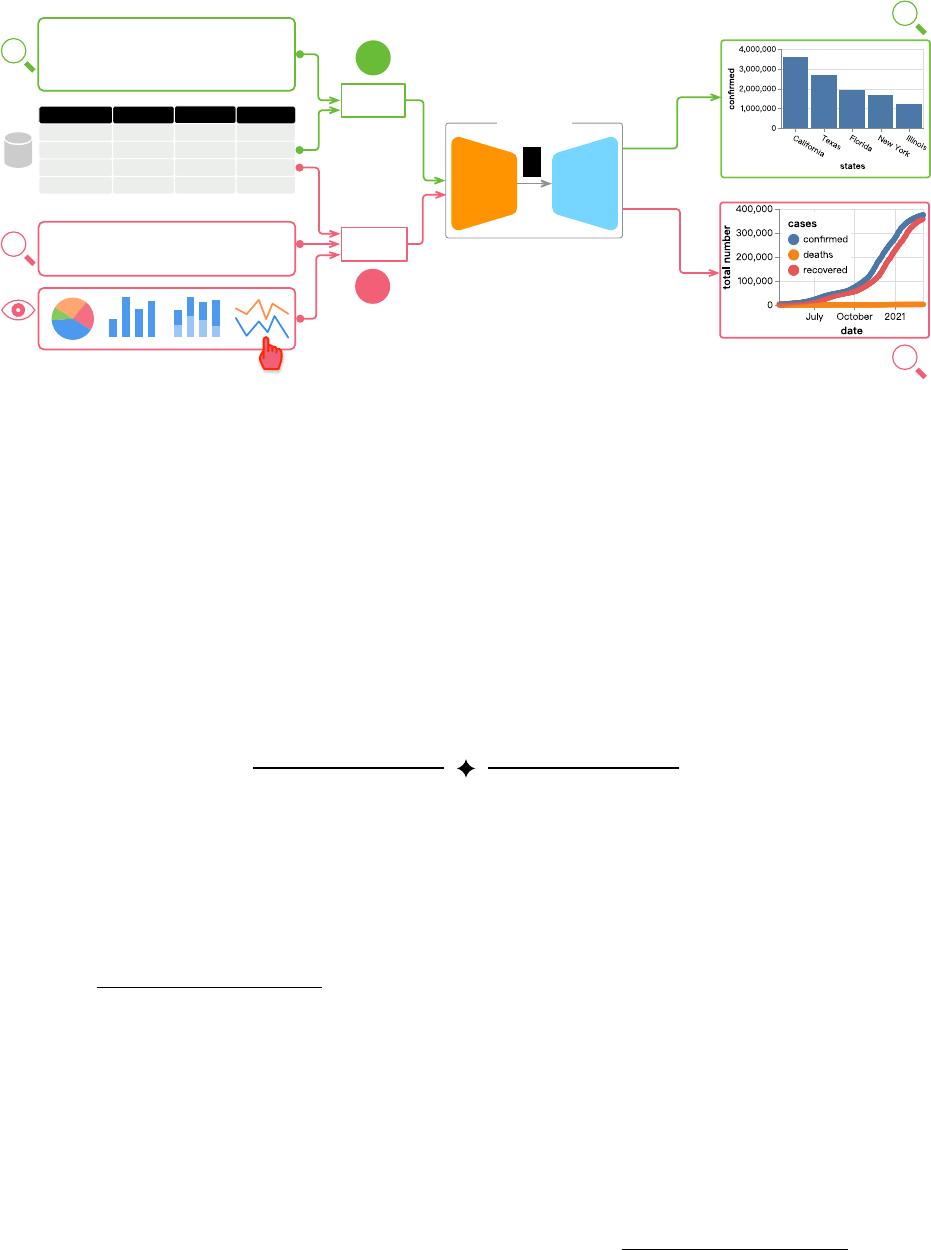
Fig. 1: We present
ncNet
, a Transformer-based sequence-to-sequence model that translates natural language queries to visualizations.
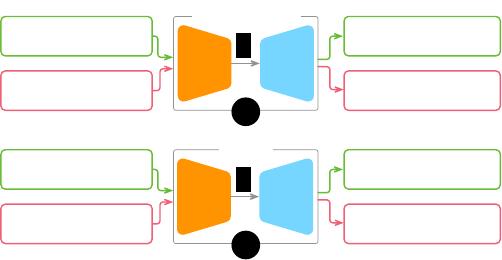
It works in two modes. (A) It takes a natural language query
N
1
and a dataset
D
as input, translates them
(N
1
,D)
into a visualization
rendered in Vega-Lite. (B) Besides a natural language query
N
2
and a dataset
D
, the user can optionally select a chart template
C
;
ncNet will translate the given input (N
2
,C,D) into a target visualization.
Abstract
— Supporting the translation from natural language (
NL
) query to visualization (
NL2VIS
) can simplify the creation of data
visualizations because if successful, anyone can generate visualizations by their natural language from the tabular data. The state-
of-the-art
NL2VIS
approaches (e.g.,
NL4DV
and FlowSense) are based on semantic parsers and heuristic algorithms, which are not
end-to-end and are not designed for supporting (possibly) complex data transformations. Deep neural network powered neural machine
translation models have made great strides in many machine translation tasks, which suggests that they might be viable for
NL2VIS
as
well. In this paper, we present
ncNet
, a Transformer-based sequence-to-sequence model for supporting
NL2VIS
, with several novel
visualization-aware optimizations, including using attention-forcing to optimize the learning process, and visualization-aware rendering
to produce better visualization results. To enhance the capability of machine to comprehend natural language queries,
ncNet
is also
designed to take an optional chart template (e.g., a pie chart or a scatter plot) as an additional input, where the chart template will be
served as a constraint to limit what could be visualized. We conducted both quantitative evaluation and user study, showing that
ncNet
achieves good accuracy in the nvBench benchmark and is easy-to-use.
Index Terms—Natural language interface; data visualization; neural machine translation; chart template;
1 INTRODUCTION
Natural language interface is a promising interaction paradigm for sim-
plifying the creation of visualizations [32, 43, 52]. If successful, even
novices can generate visualizations simply like a Google search. Not
surprisingly, both commercial vendors (e.g., Tableau’s Ask Data [46],
Power BI [2], ThoughtSpot [3], and Amazon’s QuickSight [1]) and aca-
demic researchers [7,13,20,33,34,40,42,45,49,50,57] have investigated
to support the translation from NL queries to visualizations (NL2VIS).
• Yuyu Luo, Guoliang Li, Chengliang Chai, Xuedi Qin are with the
Department of Computer Science, Tsinghua University, China. Email:
{luoyy18@mails., liguoliang@, ccl@, qxd17@mails.}tsinghua.edu.cn
• Nan Tang is with QCRI, Hamad Bin Khalifa University, Qatar. Email:
ntang@hbku.edu.qa
• Jiawei Tang is with American School of Doha, Doha, Qatar. Email:
23jtang@asd.edu.qa
• *Guoliang Li is the corresponding author.
Manuscript received xx xxx. 201x; accepted xx xxx. 201x. Date of Publication
xx xxx. 201x; date of current version xx xxx. 201x. For information on
obtaining reprints of this article, please send e-mail to: reprints@ieee.org.
Digital Object Identifier: xx.xxxx/TVCG.201x.xxxxxxx
NL2VIS
needs both natural language understanding that uses ma-
chines to comprehend natural language queries, and translation algo-
rithms to generate targeted visualization using a visualization language.
Natural language understanding is considered an AI-hard problem [56],
with many intrinsic difficulties such as ambiguity and underspecifica-
tion. Many tools from the
NLP
community, especially based on statisti-
cal phrase-based translation [26] and neural machine translation [4, 10],
have been used to tackle NL2VIS.
The state-of-the-art
NL2VIS
methods (for example,
NL4DV
[40] and
FlowSense [57]) are statistical phrase-based translation, which treats
natural language understanding and machine translation as two steps.
They first employ
NLP
toolkits (for example, NLTK [5], Stanford
CoreNLP [37], and NER [12]) to parse an
NL
query and produce a
variety of linguistic annotations (for example, parts of speech, named
entities, etc), based on which they then devise algorithms to generate
target visualizations. They are good choices when there are not many
training datasets to train deep learning models.
We present
ncNet
1
, an end-to-end solution using a Transformer-
based sequence-to-sequence (
seq2seq
) model, which translates an
NL
query to a visualization. It adopts self-attention to generate a rich repre-
1
The code is available at https://github.com/Thanksyy/ncNet
sentation (high dimensional vectors) of the input,
ncNet
enables smart
visualization inference (e.g., guessing the missing column, selecting a
chart type, etc).
Besides making smarter inferences, a system can obtain more infor-
mation (or “hint”) from the user, by either obtaining a one-shot hint
from the user or iteratively requiring more information (a.k.a. conver-
sational systems) [6]. The hint can be of various formats, such as
NL
queries, tables, chart templates, with one main criterion to be easy-to-
use. We propose to use chart templates as additional hints, where a
user can specify the output to be a pie chart or a scatter plot with a
simple click. In practice, chart templates have been widely used in all
commercial products, including Tableau, Excel, Google Sheets, and
so on. Due to the flexibility of the
seq2seq
model, we just treat the
selected chart template
C
as another sequence, together with the
NL
query N and the dataset D as the input X.
Contributions.
In this work, we make several contributions, including:
•
proposing
ncNet
, a Transformer-based [53]
seq2seq
model for
supporting NL2VIS;
•
presenting a novel visualization-grammar, namely Vega-Zero,
with the main purpose to simplify the
NL2VIS
translation using
neural machine translation techniques. Moreover, transforming it
to other visualization languages are straightforward;
•
enhancing
ncNet
by allowing the user to select a chart template,
which will be used to improve the translation accuracy;
•
devising two optimization techniques:
attention forcing
for in-
corporating pre-defined domain knowledge and
visualization-
aware translation for better final visualization generation; and
•
demonstrating that
ncNet
can well support
NL2VIS
with several
use cases, as well as conducting a quantitative study.
2 RELATED WORK
2.1 Natural Language Interface for Data Visualization
The idea of using
NL
as a way to create visualizations was explored
around two decades ago [6], where the system interacts with the user
through dialogs. During each interaction, the system tries to clarify
a small part of the user specification. For example, the system asks:
“At what organizational level?”, the user answers: “At the department
level”, and so on. At that time, the system can only map simple user
inputs to pre-defined commands.
Afterwards, semantic parsers (e.g., NLTK [5], NER [12], and Stan-
ford CoreNLP [37]), which can automatically add additional layers of
semantic information (e.g., parts of speech, named entities, coreference,
etc) to
NL
, have been widely adopted in the research of
NL2VIS
. Recent
studies, such as
NL4DV
[40] and FlowSense [57], all employ semantic
parsers, which are considered as the state of the art.
2.2 Natural Language Processing with Deep Learning
Closer to this work is
ADVISor
[27] that uses BERT [10] to generate
the embeddings of both the
NL
query and the table headers, which
are then used by an “Aggregation” network to select an aggregation
type and a “Data” network to decide used attribute and predicates –
these
SQL
fragments will determine an
SQL
query. Then, a rule-based
“Visualization” module will decide which visualization to generate.
Compared with
ADVISor
,
ncNet
supports more complex data transfor-
mation types such as relational
join
,
GroupBY
,
OrderBY
,
Or
predicate
in
SQL
WHERE clauses. Another difference is that the neural networks
of
ADVISor
are trained using (
NL
,
SQL
) pairs, while
ncNet
is trained
using (NL, VIS) pairs and outputs Vega-Zero queries.
In fact, the main obstacle of using deep learning for
NL2VIS
is not
the shortage of deep learning models or techniques. Instead, it is the
lack of benchmark datasets that these models can be trained on, because
deep learning models are known to be data hungry [14]. Fortunately,
a recent work releases the first public benchmark for
NL2VIS
, namely
nvBench
[35], which can be used to try deep learning for
NL2VIS
.
nvBench
consists of 25,750
NL
queries and the corresponding visu-
alizations, i.e., 25,750 (
NL
,
VIS
) pairs, over
∼
780 tables from 105
domains (e.g., sports, customers). We will discuss more details of
English2French
natural language to
visualization is important
le langage naturel à la
visualisation est important
a learned approach is
promising
une approche apprise est
prometteuse
A
NL2VIS
Create a bar chart showing
the top 5 states with …
mark bar encoding x states y
aggregate sum number …
Show me the trend of
confirmed, died …
mark line encoding x date y
aggregate none number …
B
Encoder Decoder
Encoder Decoder
h
h
Fig. 2: Sample
seq2seq
tasks. (A) Translation from English to French.
(B) Translation from NL queries to visualization specifications.
nvBench
in Section 6.2. Another recent work [48] collected 893
NL
queries over three datasets. However, its number is not sufficient to
train typical deep learning models.
An alternative solution is
NL2SQL
+ automatic data visualization,
which is a good choice when the entire pipeline is one-shot. However,
in practice, it is always iterative. That is, if the target visualization
needs to be refined, the user needs to verify/refine both
NL2SQL
and
check the result of automatic data visualization. Note that, checking
whether a table is good enough is hard, even for a small table with
hundreds/thousands of tuples. In this case, using end-to-end
NL2VIS
has an advantage that the user only sticks to one task, which is more
user-friendly.
3 DESIGN REQUIREMENTS
There are three main goals when devising solutions for
NL2VIS
, along
the same line of other NL2VIS tools e.g., NL4DV [40].
(1) Easy-to-use.
We want to allow novices to create visualizations sim-
ply like a Google-search. That is, even users without data visualization
background can easily generate visualizations.
(2) End-to-end.
Traditional semantic parser based translation systems
typically consist of many small sub-components that are tuned sep-
arately. In contrast, we want to deliver a complete
NL2VIS
solution
without the need of any additional steps. Besides the well-known ben-
efits of end-to-end solutions such as increased efficiency, cost cutting
and ease of learning, one particular benefit for a
seq2seq
model is
that it is easy to maintain and upgrade. For example, upgrading a
seq2seq
model from using long short-term memory (LSTM) [19] to
Transformer [53] only requires to change a few lines of code.
(3) Language-agnostic.
The main benefit to be language-agnostic is
that we just need to train one
seq2seq
model for
NL2VIS
, but can
support multiple target visualization languages. The practical need
for this is evident, because the users might use various visualization
languages constrained by different applications, such as Vega-Lite, D3,
ggplot2, and so forth.
4 BACKGROUND AND PROBLEM FORMULATION
4.1 Sequence-to-Sequence Models
A sequence-to-sequence (
seq2seq
) model [51] consists of two parts,
an encoder and a decoder, where each part can be implemented by
different neural networks. The task of an encoder is to understand
the input sequence, and generate a smaller representation
h
(i.e., a
high-dimensional vector) to represent the input. The task of a decoder
is to generate a sequence of output by taking
h
as input. The net-
work needs to be trained with a lot of training data, in the form of
(Input sequence, Output sequence) pairs.
Due to the flexibility of
seq2seq
models that allow the input and out-
put to have different formats, they have a wide spectrum of applications
including language translation [17], image captioning [38], conversa-
tional models and text summarization [39], and NL to SQL [23].
Let’s first walk through a typical translation task – lan-
guage translation from English to French (Figure 2(A)). The
of 10
免费下载
【版权声明】本文为墨天轮用户原创内容,转载时必须标注文档的来源(墨天轮),文档链接,文档作者等基本信息,否则作者和墨天轮有权追究责任。如果您发现墨天轮中有涉嫌抄袭或者侵权的内容,欢迎发送邮件至:contact@modb.pro进行举报,并提供相关证据,一经查实,墨天轮将立刻删除相关内容。
下载排行榜

评论