


VLDB2024_Time Series Data Encoding in Apache IoTDB Comparative Analysis and Recommendation_Apache IoTDB.pdf
100墨值下载
The VLDB Journal (2024) 33:727–752
https://doi.org/10.1007/s00778-024-00840-5
REGULAR PAPER
Time series data encoding in Apache IoTDB: comparative analysis and
recommendation
Tianrui Xia
1
· Jinzhao Xiao
1
· Yuxiang Huang
1
· Changyu Hu
1
· Shaoxu Song
1
· Xiangdong Huang
1
·
Jianmin Wang
1
Received: 13 January 2023 / Revised: 14 December 2023 / Accepted: 7 January 2024 / Published online: 12 February 2024
© The Author(s), under exclusive licence to Springer-Verlag GmbH Germany, part of Springer Nature 2024
Abstract
Not only the vast applications but also the distinct features of time series data stimulate the booming growth of time series
database management systems, such as Apache IoTDB, InfluxDB, OpenTSDB and so on. Almost all these systems employ
columnar storage, with effective encoding of time series data. Given the distinct features of various time series data, different
encoding strategies may perform variously. In this study, we first summarize the features of time series data that may affect
encoding performance. We also introduce the latest feature extraction results in these features. Then, we introduce the storage
scheme of a typical time series database, Apache IoTDB, prescribing the limits to implementing encoding algorithms in the
system. A qualitative analysis of encoding effectiveness is then presented for the studied algorithms. To this end, we develop
a benchmark for evaluating encoding algorithms, including a data generator and several real-world datasets. Also, we present
an extensive experimental evaluation. Remarkably, a quantitative analysis of encoding effectiveness regarding to data features
is conducted in Apache IoTDB. Finally, we recommend the best encoding algorithm for different time series referring to their
data features. Machine learning models are trained for the recommendation and evaluated over real-world datasets.
Keywords Time series · Data encoding · Data compression
1 Introduction
Time series data have special features that make them dif-
ferent from relational data. It leads to time series database
management systems, such as Apache IoTDB [25], InfluxDB
B
Shaoxu Song
sxsong@tsinghua.edu.cn
https://sxsong.github.io/
Tianrui Xia
xtr20@mails.tsinghua.edu.cn
Jinzhao Xiao
xiaojc17@mails.tsinghua.edu.cn
Yuxiang Huang
huang-yx21@mails.tsinghua.edu.cn
Changyu Hu
hucy19@mailstsinghua.edu.cn
Xiangdong Huang
huangxdong@tsinghua.edu.cn
Jianmin Wang
jimwang@tsinghua.edu.cn
1
Tsinghua University, Beijing, China
[29], OpenTSDB [20], etc. The systems use columnar stor-
age for two columns, time and value. This helps to encode
and compress time series data better. There are a number of
encoding methods provided in the systems. It is important to
select appropriate encoding referring to the features of the
data.
In general, data compression methods can be divided into
general and type-specific, or lossy and lossless, in another
sense. Though lossy approaches like expressing time series
in piecewise polynomial [13] are highly efficient in reducing
space and useful in edge or end devices, as a database, indus-
trial customers expect a complete archive of all the digital
asset, i.e., lossless. Moreover, the extremely intensive write
workloads, often machine generated in IoT scenarios, prevent
the time consuming approaches such as machine learning-
based reinforcement learning [57]. In this sense, the scope of
this study is within lossless encoding with efficient system
implementation.
While general purpose data compression methods take
generic byte sequence as the input without considering its
semantics such as SNAPPY [49] and LZ4 [3], the encod-
ing techniques often utilize the features of specific values for
123
728 T. Xia et al.
transforming them to a more concise form, e.g., the small
difference between two integers. In this study, we propose
to explore the features specialized for encoding time series,
under some intuitions like values usually not changing sig-
nificantly over time, i.e., small delta.
Different data features lead to different encoding perfor-
mances. In this paper, we present a comparative analysis of
time series data encoding techniques in Apache IoTDB, an
open-source time series database developed in our prelim-
inary studies [53]. Since the decoding process is often the
reverse of the corresponding encoding, we mainly focus on
the encoding part and omit the similar decoding part. Our
major contributions are summarized as follows.
(1) We summarize time series data features that may affect
the performance of encoding in Sect. 2. Intuitively, the
scale of values is an important factor of storage. Like-
wise, when storing the delta between two consecutive
values, it becomes a key issue. The number of value
repeats and increases are also essential to some encod-
ing ideas. The results of the latest feature extraction are
also employed as the data features.
(2) We present a qualitative analysis of encoding effective-
ness regarding to various data features in Sect. 3.It
covers classical algorithms such as RLE and also recent
proposals like BUFF [41]. While there is no winner in all
the data features, TS_2DIFF performs well in a number
of cases. For the cases where TS_2DIFF shows worse
results, such as repeat rate 1 in Fig. 24, it may be less
frequent and not that significant in practice.
(3) We devise a benchmark for time series data encoding.
It consists of (a) data generators for simulating various
data features, (b) several real-world datasets, public or
collected by our industrial partners, (c) metrics such as
compression ratio (space cost after encoding and com-
pressing divided by original space cost). I n particular,
multiple features could vary at the same time in the gen-
erator, such as large values but small deltas, so that the
distinct cases favored by different algorithms could be
illustrated. Moreover, it supports both numerical and text
values.
(4) We conduct an extensive experimental evaluation in
Sect. 6. The quantitative analysis generally verifies the
aforesaid qualitative analysis of encoding performance
regarding to various data features.
(5) We propose TSEC, a machine learning tool to recom-
mend encoding algorithms by data features in Sect. 7.
We choose the best classifier for TSEC from popular
ones, and compare TSEC with others.
Finally, we also discuss some related work in Sect. 8, and out-
line some future directions in Sect. 9 referring to the analysis.
The source code of encoding algorithms has been deployed
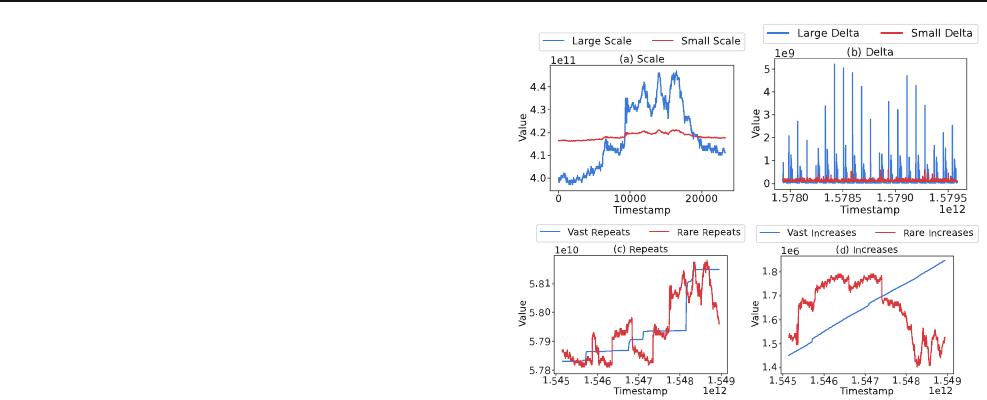
Fig. 1 Example of real data with distinct features on a large/small
scale, b large/small delta, c vast/rare repeats and d vast/rare increases,
affecting encoding performance
in the GitHub repository of Apache IoTDB [22]. The exper-
iment related code and data are available in [23].
2 Data features
To be able to analyze how the encoding algorithms perform in
different data, and consequently recommend proper encod-
ing algorithms, we select several features that may affect
the performance of encoding, including scale, delta, repeat
and increase. Figure 1 presents some typical examples of (a)
large/small scale, (b) large/small delta, (c) vast/rare repeats
and (d) vast/rare increases.
These features reflect the characteristics of data values in
terms of size, change, repetition and trend. For simplicity,
we use TS =[v
1
,v
2
,...,v
n
] to denote the value list of
time series. In the following subsections, we will define and
analyze each feature in detail.
2.1 Scale for numerical data
The scale of data is one of the most important factors in
storage. In general, the larger the values are, the more bits
we need to encode them. The scale of data also affects the
performance of different compression methods. For example,
some methods need to store a header for each value, which
requires more bits for larger values.
To this end, we employ the mean, standard deviation and
spread (maximum minus minimum) of the values in time
series TS, denoted by Mean(TS), Std(TS), and Spread(TS)
to represent the scale features.
In addition to the traditional features on scale, we consider
another SB_BinaryStats_mean_longstretch1(TS), abbrevi-
123
of 26
100墨值下载
【版权声明】本文为墨天轮用户原创内容,转载时必须标注文档的来源(墨天轮),文档链接,文档作者等基本信息,否则作者和墨天轮有权追究责任。如果您发现墨天轮中有涉嫌抄袭或者侵权的内容,欢迎发送邮件至:contact@modb.pro进行举报,并提供相关证据,一经查实,墨天轮将立刻删除相关内容。
下载排行榜

评论