


ICDE 2025_DataVisT5:A Pre-trained Language Model for Jointly Understanding Text and Data Visualization.pdf
免费下载
DataVisT5: A Pre-trained Language Model for
Jointly Understanding Text and Data Visualization
Zhuoyue Wan
∗
, Yuanfeng Song
†
, Shuaimin Li
∗
, Chen Jason Zhang
∗
, Raymond Chi-Wing Wong
‡
∗
PolyU, Hong Kong, China
†
WeBank Co., Ltd, Shenzhen, China
‡
HKUST, Hong Kong, China
Abstract—Data visualization (DV) is the fundamental and
premise tool to improve the efficiency in conveying the insights
behind the big data, which has been widely accepted in existing
data-driven world. Task automation in DV, such as converting
natural language queries to visualizations (i.e., text-to-vis), gener-
ating explanations from visualizations (i.e., vis-to-text), answering
DV-related questions in free form (i.e. FeVisQA), and explicating
tabular data (i.e., table-to-text), is vital for advancing the field.
Despite their potential, the application of pre-trained language
models (PLMs) like T5 and BERT in DV has been limited by high
costs and challenges in handling cross-modal information, leading
to few studies on PLMs for DV. We introduce DataVisT5, a novel
PLM tailored for DV that enhances the T5 architecture through a
hybrid objective pre-training and multi-task fine-tuning strategy,
integrating text and DV datasets to effectively interpret cross-
modal semantics. Extensive evaluations on public datasets show
that DataVisT5 consistently outperforms current state-of-the-art
models and higher-parameter Large Language Models (LLMs) on
various DV-related tasks. We anticipate that DataVisT5 will not
only inspire further research on vertical PLMs but also expand
the range of applications for PLMs.
Index Terms—pre-trained language model, data visualization,
text-to-vis, vis-to-text, FeVisQA, table-to-text
I. INTRODUCTION
Data visualizations (DVs) utilize graphical representation to
convey insights to summarize the massive raw data, which is a
common practice in existing big data era [1], [2]. Popular data
analysis and database applications, such as Google Sheets
1
and Microsoft Power BI
2
, all support DV features. Many
institutions realize the value of DV and have applied it as their
daily fundamental tools. Thus the ability of creating suitable
DVs has become a necessary skill for data analysts, engineers,
and data scientists [3]–[5]. However, creating appropriate
DVs remains challenging, even for experts, since it requires
visual analysis expertise and familiarity with the domain data.
Furthermore, users must master the complex grammar of
Declarative Visualization Languages (DVLs), such as Vega-
Lite [6], ggplot2 [7], and Vega-Zero [8], to accurately define
DV specification in the visualization engine.
To lower the barriers to creating DVs and further unlock
the power of DV for the general public, researchers have
proposed a variety of DV-related tasks that have attracted sig-
nificant attention from both industrial and academic researchers.
Numerous studies on these topics have been presented in
leading conferences and journals such as VLDB [2], [9], [10],
ICDE [11], [12], SIGMOD [13]–[15], and TKDE [16], [17].
1
https://www.google.com/sheets/about/
2
https://powerbi.microsoft.com/
These tasks include text-to-vis (i.e., automatically generating
DVs from natural language questions) [8], [15], vis-to-text
[18] (i.e., automatically generating interpretations of complex
DVs for educational purposes), FeVisQA [12] (i.e., free-form
question answering over data visualization), and table-to-text
(i.e., describing a given table) [19].
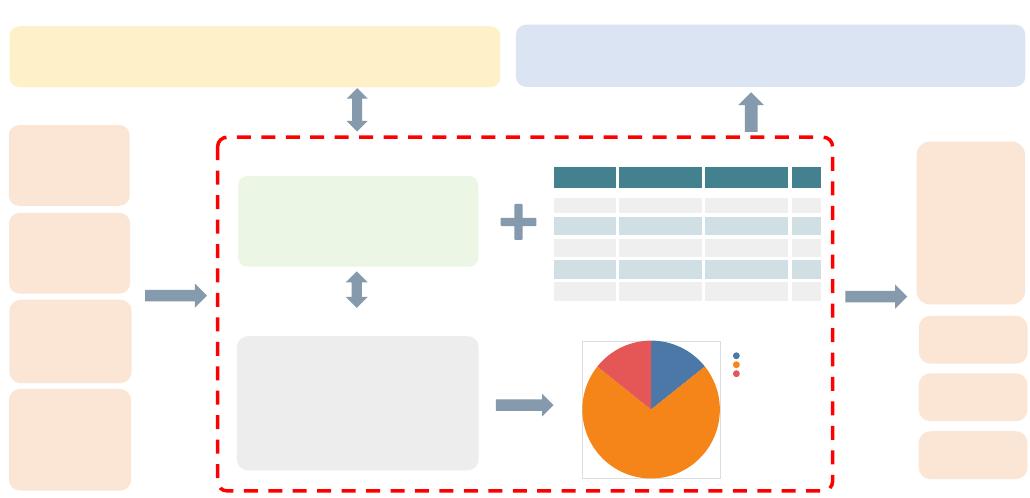
A vivid example is given in Figure 1, which shows four
important tasks central to the domain knowledge of DV: text-to-
vis, vis-to-text, FeVisQA and table-to-text. The figure presents
a natural language (NL) question, “Give me a pie chart about
the proportion of the number of countries in the artist table.”
This example demonstrates the text-to-vis task’s capability
to interpret the NL question and transform it into a Vega-
Lite specification, resulting in a pie chart. The DV query,
introduced by [15], serves as a bridge in the text-to-vis process,
encapsulating visualization details and data operations with a
grammar akin to SQL. Translations between DV queries and
DVLs are seamless, with text-to-vis tasks primarily focusing
on converting NL questions into DV queries. Conversely,
the vis-to-text task aims to generate accessible and user-
friendly explanations of complex visualizations for individuals
without expertise in the field. The FeVisQA task addresses
user inquiries regarding DV by providing detailed answers
to common questions. We present four typical DV-related
questions, including understanding the semantics of a DV query,
resolving numerical issues within a chart, and evaluating the
compatibility of a DV query with a given database. Lastly,
the table-to-text task generates informative NL description of
tabular data, which are essential for visual analytics, thereby
reducing the perceptual effort needed for data interpretation.
Meanwhile, PLMs such as BERT [20] and T5 [21] have
received considerable attention in the realms of natural lan-
guage processing (NLP) and data mining, becoming widely
recognized for their efficacy. These PLMs greatly promote
the development of effective text-driven applications, since
they show dominating performance in understanding the
semantics in natural language. The operational paradigm for
these PLMs typically unfolds in two stages: initially, they
undergo unsupervised pre-training on expansive, open-domain
datasets (such as Wikipedia) to acquire foundational capabilities
in language representation and comprehension; subsequently,
they are fine-tuned on specialized corpora pertinent to targeted
downstream tasks, thereby enhancing task-specific performance.
Despite their success [22]–[24], there are still significant
challenges when it comes to the DV field : (i) Limited studies
have been conducted to explore the effectiveness of PLMs in
arXiv:2408.07401v2 [cs.CL] 27 Nov 2024
<NL> What are the ids and details of events that have more than one participants , and I want to
rank in descending by the X-axis . <schema> | local_govt_in_alabama | participants :
participants.participant_id , participants.participant_type_code , participants.participant_details |
events : events.event_id , events.service_id , events.event_details
<VQL> visualize bar select events.event_details ,
events.event_id from events join participants_in_events
on events.event_id = participants_in_events.event_id
group by events.event_details order by
events.event_details desc
<NL> Bar chart of total number of height from each sex
, and list from high to low by the X-axis .
<Answer> Show how many country from each country ,
and display total number from high to low order .
<Table> Most popular social networks of female beauty consumers in the United States as of
August 2016 | col : Response | Percentage of respondents row 1 : Facebook | 93% row 2 :
Pinterest | 73% row 3 : YouTube | 63% row 4 : Twitter | 63% row 5 : Instagram | 62% row 6 :
LinkedIn | 36% row 7 : Snapchat | 32% row 8 : Etsy | 31% row 9 : Sephora Community | 25%
row 10 : WhatsApp | 11%
<NL> This statistic presents the reach of the most
popular social networks among female beauty
consumers in the United States as of August 2016 .
During this period there were approximately 39
thousand hectares of peas grown in England .
DataVisT5
Hybrid
Pre-training
<VQL> visualize bar select people.sex , sum(people.height) from people group by people.sex
order by people.sex desc <schema> | candidate_poll | people : people.people_id , people.sex ,
people.name , people.date_of_birth , people.height , people.weight
Text-to-Vis
DV Question Answering
Table-to-Text
Mask Language Modeling
<VQL> visualize <M1> select people.sex ,
sum(people.height) from <M2> by people.sex <M3> desc
visualize <Mask_1> select people.sex , sum(people.height) from <Mask_2> by people.sex
order <Mask_3> people.sex <Mask_4>
<Mask_1> bar <Mask_2> people group <Mask_3> by
<Mask_4> desc
<Question> What is the meaning of this VQL ? <VQL> visualize bar select artist.country ,
count(artist.country) from artist group by artist.country order by count(artist.country) desc
<schema> | theme_gallery | artist : artist.artist_id , artist.name , artist.country , artist.year_join ,
artist.age <Table> | col : artist.country | count(artist.country) row 1 : United States | 5 row 2 :
Zimbabwe | 1 row 3 : Fiji | 1
Text-to-Vis
Vis-to-Text
FeVisQA
Table-to-Text
MLM
Visualize pie
Select (country Artist)
Count (country Artist)
Grouping (country Artist)
Give me a pie chart about the proportion of the number of
countries in the artist table.
DV Query
NL Question
Text-to-Vis
Render
Vis-to-Text
Visualization Chart
Database/Dataset
Table description
This table provides a concise summary of key details about seven artists,
including their unique ID, name, country of origin, and ages.
Table-to-Text
{ "data": {“url”:
“data/artist.json”},
"mark": “pie",
"encoding": {
"x": { "field": “country "},
"y": {“aggregate": “count"}}
}
Visualization Specification
Vega-Lite
Question 3:
Is this DV
suitable for this
given dataset?
DV Question
FeVisQA FeVisQA
Question 2:
How many
parts are there
in the chart?
Question 1:
What is the
meaning of this
DV?
Question 4:
What is the
value of the
largest part in
the chart?
Answer 1:
Show all
countries in
the artist
table with a
pie chart
showing their
proportions.
DV Answering
Answer 2:
3
Answer 3:
Yes
Answer 4:
5
Artist_ID Name Country Age
1 Vijay Singh Fiji 45
2 John Daly United States 46
3 Paul Azinger United States 47
…
… … …
7 Nick Price Zimbabwe 48
Fiji
United States
Zimbabwe
Country
This table provides a concise
summary of key details about
seven artists, including their
unique ID, name, country of
origin, and ages.
DV Query
This table provides a concise summary of key details about seven
artists, including their unique ID, name, country of origin, and ages.
Table description
Table description
This table provides a concise summary of key details about seven artists,
including their unique ID, name, country of origin, and ages
Fig. 1: An illustration depicting the text-to-vis, vis-to-text, table-to-text, and free-form question-answering over data visualization
problems, showcasing examples including a NL question, a DV query, a DVL visualization specification, a table description, a
visualization chart, and four question-answer pairs.
capturing the DV semantics. (ii) Since there is a substantial
modal gap between the DV modality and the text modality,
satisfied performances cannot be achieved by directly applying
existing PLMs (e.g., T5) to DV-related tasks mentioned above.
(iii) In the DV area, a possible PLM needs the ability of
handling cross-modal information (i.e., text and DV), while
also being capable of managing multiple distinct tasks.
To alleviate above-mentioned problems, we propose a novel
PLM for jointly understanding text and DV, refereed as
DataVisT5 in this paper. Based on text-centric T5 architec-
ture, we enhance the pre-training process by incorporating a
comprehensive array of cross-modal datasets that integrate
natural language with DV knowledge, encompassing DV
queries, database schemas, and tables. Since DV queries
resemble programming language-like queries, we employ
CodeT5+ [25] as the starting checkpoint in our work. This
choice leverages the robust code semantic understanding and
generation capabilities of CodeT5+, providing DataVisT5 with
a substantial advantage in generating and comprehending the
unique programming language of our DV tasks. Building on
this foundation, we apply table-level database schema filtration
to reduce training complexity. Addressing the challenges of
format consistency between DV and textual modalities, we
introduce a unified encoding format for DV knowledge that
facilitates the convergence of text and DV modalities. To
eliminate stylistic discrepancies in manually curated datasets,
we adopt standardized encoding.
Additionally, the pre-training objectives for DataVisT5 are
twofold: (i) the span corruption approach of Masked Language
Modeling as utilized by the original T5 model, and (ii) a
Bidirectional Dual-Corpus objective that operates on source-
target pairings. After the mixed-objective pre-training, we
conduct multi-task fine-tuning (MFT) of our DataVisT5 on
DV-related tasks including text-to-vis, vis-to-text, FeVisQA,
and table-to-text. To substantiate the rationale behind our
proposed model, we performed comprehensive experimental
evaluations on various public datasets. The results consistently
demonstrate that DataVisT5 surpasses the state-of-the-art
(SOTA) models and higher-parameter LLMs. In summary, our
main contributions are as follows:
•
We introduce and release DataVisT5: the first Pre-trained
Language Model (PLM) tailored for the joint understand-
ing of text and DV. This innovation opens avenues for
future research on task-specific PLMs and enriches the
landscape of PLM designs.
•
We enhance the text-centric T5 architecture to handle
cross-modal information. Our novel hybrid pre-training
objectives are conceived to unravel the complex interplay
between DV and textual data, fostering a deeper integration
of cross-modal insights.
•
Extensive experiments on public datasets for diverse DV
tasks including text-to-vis, vis-to-text, FeVisQA, and table-
to-text demonstrate that DataVisT5 excels in multi-task
settings, consistently outperforming strong baselines and
establishing new SOTA performances.
II. PRELIMINARY
This section provides the foundational concepts and def-
initions pivotal to DV-related tasks, with the objective of
cultivating a more profound understanding.
Natural Language Question. An NL question enables users,
even those with a minimal background in DV and programming
of 15
免费下载
【版权声明】本文为墨天轮用户原创内容,转载时必须标注文档的来源(墨天轮),文档链接,文档作者等基本信息,否则作者和墨天轮有权追究责任。如果您发现墨天轮中有涉嫌抄袭或者侵权的内容,欢迎发送邮件至:contact@modb.pro进行举报,并提供相关证据,一经查实,墨天轮将立刻删除相关内容。
下载排行榜

文档被以下合辑收录
评论