


DBMind - A Self-Driving Platform in openGauss.pdf
免费下载

DBMind: A Self-Driving Platform in openGauss
Xuanhe Zhou
§∗
, Lianyuan Jin
§∗
, Ji Sun
§
, Xinyang Zhao
§
, Xiang Yu
§
, Jianhua Feng
§
, Shifu Li
♣
,
Tianqing Wang
♣
, Kun Li
♣
, Luyang Liu
♣
§
Department of Computer Science,Tsinghua University, Beijing, China
♣
Gauss Department, Huawei Company, Beijing, China
{zhouxuan19,jinly20,sun-j16,xy-zhao20,x-yu17}@mails.tsinghua.edu.cn,fengjh@tsinghua.edu.cn,
{lishifu,wangtianqing2,likun75,liuluyang2}@huawei.com
ABSTRACT
We demonstrate a self-driving system
DBMind
, which pro-
vides three autonomous capabilities in database, including
self-monitoring
,
self-diagnosis
and
self-optimization
.
First,
self-monitoring
judiciously collects database metrics and
detects anomalies (e.g., slow queries and IO contention), which
can prole database status while only slightly aecting system per-
formance (<5%). Then,
self-diagnosis
utilizes an LSTM model
to analyze the root causes of the anomalies and automatically
detect root causes from a pre-dened failure hierarchy. Next,
self-optimization
automatically optimizes the database perfor-
mance using learning-based techniques, including deep reinforce-
ment learning based knob tuning, reinforcement learning based
index selection, and encoder-decoder based view selection. We have
implemented
DBMind
in an open source database openGauss and
demonstrated real scenarios.
PVLDB Reference Format:
Xuanhe Zhou, Lianyuan Jin, Ji Sun, Xinyang Zhao, Xiang Yu, Jianhua Feng,
Shifu Li, Tianqing Wang, Kun Li, Luyang Liu. DBMind: A Self-Driving
Platform in openGauss. PVLDB, 14(12): 2743 - 2746, 2021.
doi:10.14778/3476311.3476334
1 INTRODUCTION
Traditional databases rely on DBAs to diagnose and optimize the
databases in order to meet the high-performance requirements.
However, these manual methods cannot satisfy the requirements
for rapidly growing users, data, and workloads, and thus it calls for
a self-driving database management platform that automatically
monitors, diagnoses and optimizes databases. For example, suppose
a cloud database provider maintains 100,000 database instances
and one DBA can manage 100 database instances. It requires one
thousand DBAs to maintain these instances. To make the things
worse, some tricky problems (e.g., disk crash) require DBAs to take
hours to trace and recover the database.
Existing databases mainly have three limitations [
3
,
13
]. First,
there are hundreds of system metrics, and current databases cannot
eciently detect anomalies (e.g., slow query, IO contention) and
potential risks (e.g., insucient disk space) with basic statistical
methods. Besides, it is expensive to rely on DBAs to detect large
This work is licensed under the Creative Commons BY-NC-ND 4.0 International
License. Visit https://creativecommons.org/licenses/by-nc-nd/4.0/ to view a copy of
this license. For any use beyond those covered by this license, obtain permission by
emailing info@vldb.org. Copyright is held by the owner/author(s). Publication rights
licensed to the VLDB Endowment.
Proceedings of the VLDB Endowment, Vol. 14, No. 12 ISSN 2150-8097.
doi:10.14778/3476311.3476334
scale statistical data, especially for cloud databases with millions
of instances. Second, existing databases cannot automatically diag-
nose the root causes of the detected anomalies, because there are
numerous highly correlated database modules and it is laborious
to rely on experts to label the anomaly cases. Third, the optimiza-
tion techniques (e.g., query rewrite, index suggestion) in current
databases are mainly heuristics and they may nd sub-optimal so-
lutions under complex scenarios. For example, for a nested query,
openGauss creates a temporary table for the uncorrelated subquery
but cannot consider the optimization within the subquery.
To address these challenges, we propose learning-based tech-
niques, build a self-driving database platform
DBMind
and demon-
strate the following features (Figure 1).
(1)
Self-monitoring
monitors and collects the information of
database instances. The information includes
(i )
OS resource met-
rics,
(ii)
database status metrics,
(iii)
log alarm metrics. It monitors
each database instance and stores the collected information in a
storage system on the user side or time-series databases integrated
in the server side. Moreover,
Self-monitoring
detects anomalies
from the time-series data by
(i )
identifying abnormal indicators
with spectral residual algorithm [
5
] and
(ii)
utilizing prediction
algorithms (e.g., graph neural networks [
14
]) to predict future risks
(e.g., slow queries, resource anomaly, performance degradation, and
security anomaly).
(2)
Self-diagnosis
trains an LSTM model to learn root causes
from both normal and abnormal data. Besides, it constructs a m
(which organizes the failure category-subcategory into a hierarchy)
to store representative metrics and root causes. For any abnor-
mal data, we compute an abnormal vector with the Kolmogorov-
Smirnov test and match the root cause in the failure hierarchy to
detect the root cause.
(3)
Self-optimization
proposes learning-based techniques to
optimize the databases, including reinforcement learning tech-
niques for index recommendation, deep reinforcement learning
techniques for knob tuning [
4
,
12
], and encoder-decoder model for
materialized view recommendation [2].
DBMind
diers from existing database systems in two main as-
pects: (1)
DBMind
designs eective learned methods to realize self-
monitoring, self-diagnosis, and self-optimization; (2)
DBMind
is in-
tegrated into an open source database opengauss and achieves both
high usability and robustness. Experiments on real datasets have
veried that
DBMind
can quickly discover slow SQL statements, give
optimization suggestions in real time, save DBA time by over 80%,
identies and solves potential risks (e.g., disk crash).
* These authors contribute equally to this work
2743
Data Collector
User SideServer Side
Server
Indicator
Forecast
Runtime
Prediction
Index
Advisor
……
buffer
Time-series Database
fetch
Agent
…
DB
metric1
metric2
pull sourceprocessor
fetch
Agent
DB
Web Service
det ect ion
monitor
……
QPS Abnormal
High CPU Load
High IO Load
Interface delay Interface failure
IO waits
Request foc us
Slow queries
Hardwa re iss u es
openGauss
parse
clas s
analyz e
MV
rewrite
hint
tuning
algorithm
statistics
interaction
Self-Diagnosis Self-Optimization
Self-Monitoring
slow
Large spill files No index
QPS
index
query
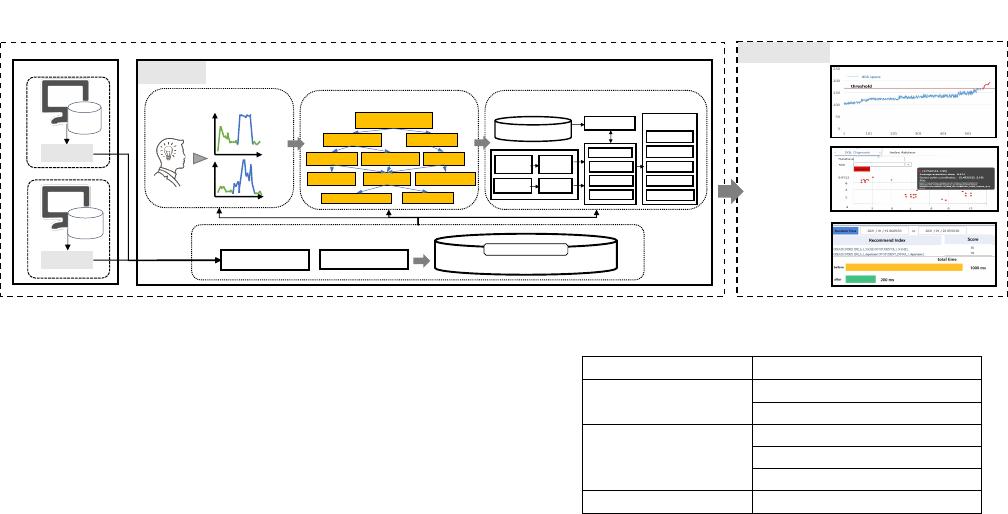
Figure 1: The Workow of DBMind
2 SYSTEM IMPLEMENTATION
DBMind
utilizes machine learning models [
1
,
2
,
4
–
10
,
14
] to detect,
analyze, and resolve database problems eciently and eectively.
2.1 System Overview
The
DBMind
system is composed of three main components:
agent
,
server
, and
web interface
. Figure 1 shows the architecture of
our DBMind system.
Agent Module:
We rst provide abundant statistic information
for the users and following modules. Each agent in the data-
base instance places three dierent data exporters (data collection
units): os_exporter, database_exporter and alarm_log_exporter. (1)
os_exporter collects the resource metrics of the operation system
(e.g., CPU, memory, I/O); (2) database_exporter collects database
metrics (e.g.,
xact _commit
); (3) alarm_log_exporter collects the log
alarm information of the database (e.g., slow queries). Some metrics
of exporters are shown as the Table 1. Note that the
agent
module
is extensible and we can easily add more exporters into it.
Web Service.
We provide a
web interface
to help users easily
monitor the running states of the database instance (e.g., resource
utilization, overall health score). In the
web interface
, we pro-
vide three main functions:
(i )
demonstrate database status (e.g.,
resource metrics, slow SQLs, and abnormal log information) and
overall health score;
(ii)
when abnormal data occurs,
DBMind
calls
corresponding analysis and repair functions, demonstrates the op-
timization results (e.g., abnormality type, optimizations) and risks.
Server Module:
To eciently support the three autonomous ca-
pabilities, we devise an end-to-end optimization pipeline and ab-
normality detection/analysis/optimization algorithms. Section 2.2
introduces how to detect potential risks from a large amount of
time-series data, and Section 2.3 describes techniques for diagnosing
root causes of the detected risks. And we discuss how to judiciously
optimize the database problems in Section 2.4.
2.2 Self-Monitoring Module
There are two main challenges in
self-monitoring
. First,
databases generate a large amount of statistical data every day
and we need to eciently detect anomaly from those data. Second,
there are noises in the logs (e.g., incompletely logged workload by
interrupts) and it is important to predict the performance. Hence,
the
self-monitoring
module periodically reads the latest data
from the local time-series database, and detects anomaly events
Table 1: Example metrics in self-monitoring
Exporters Metrics
OS_exporter
CPU utility
disk space/IO utility
Database_exporter
index/table Information
SQL Information
buer pool/lock information
Alarm_log_exporter alarm log information
with the
Abnormal Discovery Service
and
Trend Analysis
Service (Figure 2).
(1)
Anomaly Discovery Service
analyzes and detects the key
indicators of the database periodically (e.g., every second). Since
there are numerous time-series data and we have few labeled data,
we utilize the spectral residual algorithm (an unsupervised method)
to conduct anomaly detection. The algorithm includes three steps:
(i )
Utilize Fourier transform to convert the history data (e.g., re-
sources, OS interrupts) into amplitude spectrum and phase spec-
trum;
(ii)
Change the amplitude spectrum into logarithmic spec-
trum and obtain the signicant part of the spectrum;
(iii)
Use the
inverse Fourier transform to obtain the correlation saliency map.
This way, we can shrink the normal part and enlarge the ab-
normal data. And by setting the abnormal threshold based on the
extreme value theory, we obtain the abnormal information (e.g.,
workload drop) and send it to the RCA module (Section 2.3).
(2)
Trend Analysis Service
analyzes the consumption of sys-
tem resources (e.g., CPU, memory, disk space), and predicts the
future consumption of resources based on the runtime prediction
algorithm. For example, we model the concurrent queries as a work-
load graph, where the vertices are operators and edges are their
relations, and apply graph embedding algorithm [
14
] to estimate
resource consumption (e.g., runtime, memory consumption). If a
resource is found to be insucient to support incoming workloads,
an alarm message is sent, which reects the overall health state of
the database and guides further optimization.
2.3 Self-Diagnosis Module
The Root Cause Analysis (
RCA
) Module accepts standardized anom-
aly alarms from the
Self-monitoring
module, and analyzes the
root cause of the anomaly. Existing databases usually employ ex-
perienced DBA to diagnose the root causes manually, which is
dicult since the state metrics are complex and lack of domain
2744
of 4
免费下载
【版权声明】本文为墨天轮用户原创内容,转载时必须标注文档的来源(墨天轮),文档链接,文档作者等基本信息,否则作者和墨天轮有权追究责任。如果您发现墨天轮中有涉嫌抄袭或者侵权的内容,欢迎发送邮件至:contact@modb.pro进行举报,并提供相关证据,一经查实,墨天轮将立刻删除相关内容。
下载排行榜

评论