


2022年中国投资策略展望:尘埃落定后会是更好的一年(英)-瑞信-2022
5墨值下载
China Market Strategy
Outlook 2022: A better year when the dust
settles
Strategy | Strategy
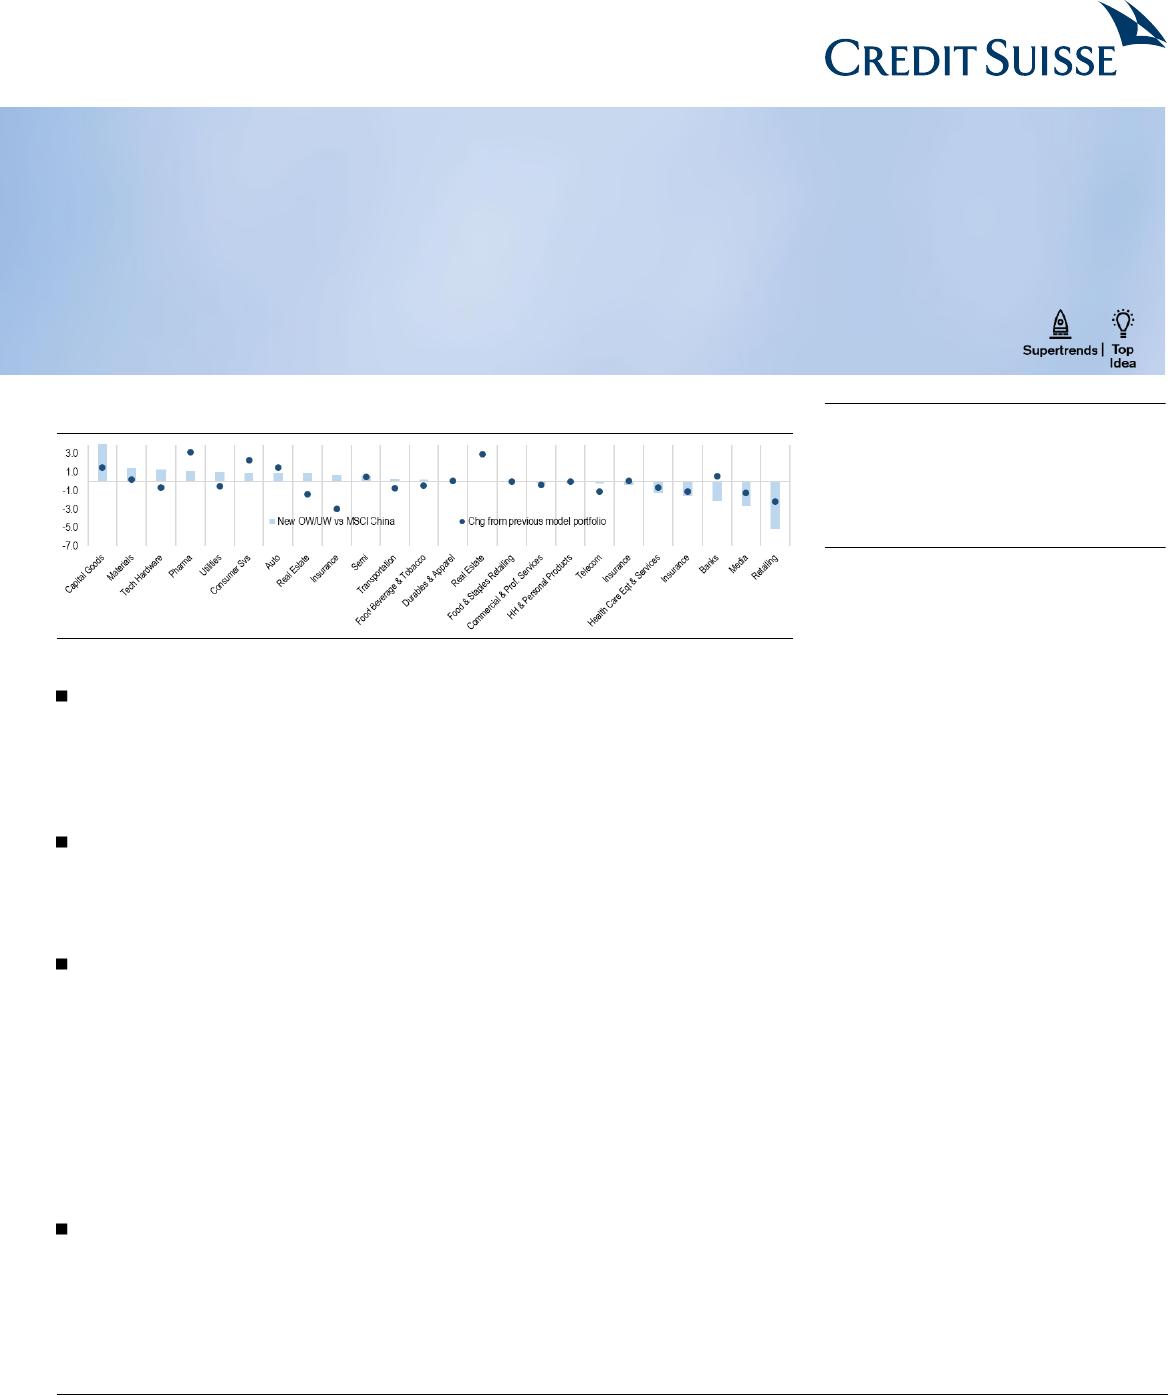
Figure 1: New sector weighting of CS China model portfolio
Source: Refinitiv, Credit Suisse estimates
Macro economy set to bottom out. Following a V-shaped recovery in 2020, China’s
growth lost momentum since 3Q21 due to resurging COVID, summer flooding, unexpected
power cuts and property tightening. We expect to see moderate recovery in 2H22, after a
still tough 1H22. We expect China to speed up fiscal expenditure, carry out a constructive
monetary policy and adjust the implementation pace for China’s long-term development
goals such as common prosperity and carbon neutrality.
On-the-ground checks suggest a mixed outlook. According to the CS CQi team’s
industry and consumer surveys, property sales managers confirmed the moderate easing;
material producers are still cautious on demand outlook and expect the high power tariffs to
sustain for longer; private SME manufacturers are cautious about the year while service
providers are more optimistic.
2022 to be a better year for stocks after correction. China and Hong Kong equity
markets experienced remarkable corrections in 2021, with dramatic sector rotation. Sixteen
out of 22 sectors declined, led by consumer services, Macau, software, insurance and real
estate. Only 36% of sectors managed to achieve more positive monthly returns than
negative in 2021, in sharp contrast to 64% in 2020. Downward revision of corporate
earnings was also not helpful. However, the central government is swiftly taking action to
stabilise the economy, and fine-tuning macro and industry policies accordingly, which sends
a positive policy signal. We expect China’s equity market is set to recover, given positive
policy direction, low investor expectation, and cheap valuation, despite a near-term slowing
economy. Our new index targets for MSCI China/HSI/CSI300 are 91/26,200/5,760,
offering 11.7%/13.4%/17.0% upsides respectively.
Focus on bottom up. We continue to expect multi-year secular themes to play out in
2022 but take a more bottom-up approach in sector selection, given lack of clear direction
of style and sector rotation. Our top 5 sector-relative weightings are industrials (+4.2%), IT
(+1.6%), materials (+1.5%), utilities (+1.0%) and energy (+0.8%), versus big under-
weights in consumer discretionary (-3.2%), communication services (-2.9%) and financials
(-2.8%). We had the largest increases in real estate (+3.0%), healthcare (+2.6%), and
consumer discretionary (+1.8%) and trimmed our big overweighting in energy.
3 January 2022
Equity Research
Asia Pacific | China
DISCLOSURE APPENDIX AT THE BACK OF THIS REPORT CONTAINS IMPORTANT DISCLOSURES, ANALYST CERTIFICATIONS,
LEGAL ENTITY DISCLOSURE AND THE STATUS OF NON-US ANALYSTS. US Disclosure: Credit Suisse does and seeks to do business
with companies covered in its research reports. As a result, investors should be aware that the Firm may have a conflict of interest that could
affect the objectivity of this report. Investors should consider this report as only a single factor in making their investment decision.
Research Analysts
Edmond Huang
852 2101 6701
edmond.huang@credit-suisse.com
Contributing analyst:
Kenneth Fong
Charles Zhou
Bin Wang
Kyna Wong
Yang Huang
Horace Tse
Alex Liu
Jianping Chen
Hu Shen
Gary Zhou
Chaolien Tseng
Ivy Ji
Lok Kan Chan
Iris Zheng
Jasmine Wang
Ashley Xu
Jason Liu
Peter Li
Clive Cheung
Ting Wang
Timothy Chau
Frank Zheng
Jocelyn Zhang
Veronica Song
Harriet Liu
Summer Wang
Sabrina Shao
Daniel Cui
Moxy Ying
Nathan Chen
Kin Nang Chik
3 January 2022
China Market Strategy
2
Focus charts
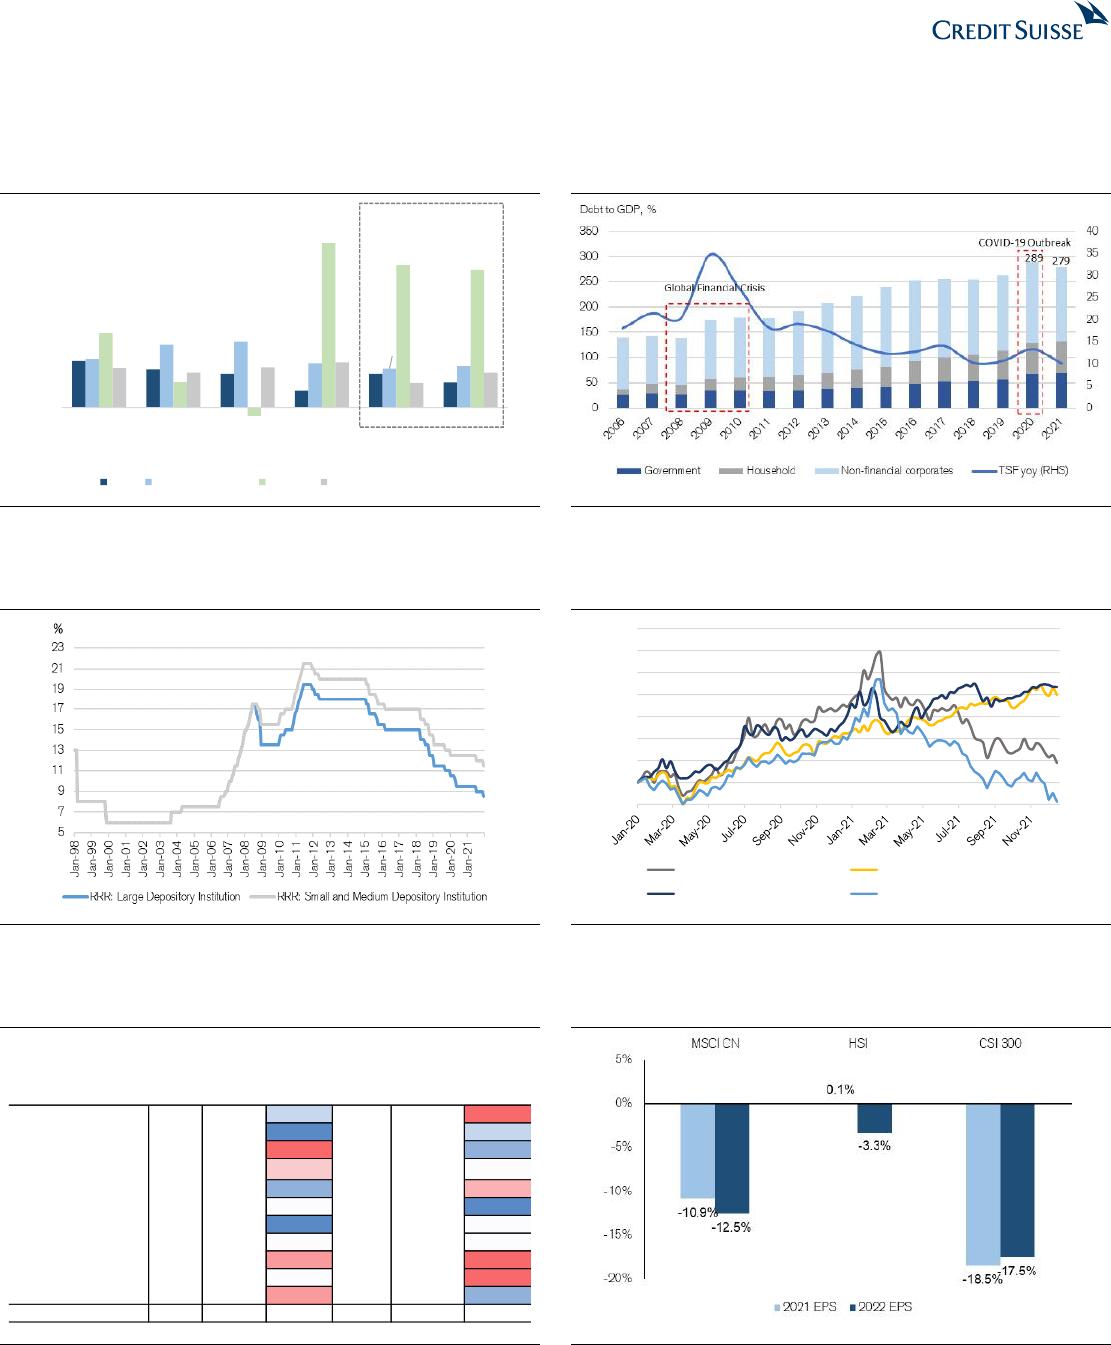
Figure 2: Major indicators two-year CAGRs—from 11M 2019 to
11M 2021
Figure 3: China has a higher degree of tolerance towards macro
leverage
Source: NBS, Credit Suisse estimates
Source: BIS, PBoC, Credit Suisse estimates
Figure 4: RRR—large vs small and medium financial institutions
Figure 5: Performance of NASDAQ100 & ChiNext Index
diverged from HSTech & NASDAQ Golden Dragon China Index
Source: Wind, PBoC, Credit Suisse estimates
Note: Rebased to 03-Jan-2020, data updated to 17-Dec-2021.
Source: the BLOOMBERG PROFESSIONAL™ service;
Figure 6: Number of months posting gains/losses by sector
Figure 7: 2021 YTD revision of 2021E EPS and 2022E EPS
Note: Hit rate calculated as the number of sectors posting more than 6 months of
gains divided by the number of total sectors.
Source: Refinitiv, Credit Suisse
Note: Data as of 17-Dec-2021.
Source: Refinitiv, Credit Suisse
5.2%
3.9%
6.0%
6.4%
22.0%
21.2%
3.8%
5.4%
-5%
0%
5%
10%
15%
20%
25%
30%
11M2017 11M2018 11M2019 11M2020 11M2021 11M2021*
FAI Real Estate FAI Export Industrial production
2-year CAGR
from 11M2019
YoY
80
100
120
140
160
180
200
220
240
Hang Seng Tech Nasdaq 100
ChiNext NASDAQ Golden Dragon China Index
No. of
months
with gains
No. of
months
with losses
Ratio
No. of
months
with gains
No. of
months with
losses
Ratio
Consumer Discretionary 8 4 0.67 4 8 0.33
Consumer Staples
10 2 0.83 7 5 0.58
Energy 4 8 0.33 8 4 0.67
Financials
6 6 0.50 6 6 0.50
Health Care 9 3 0.75 5 7 0.42
Industrials
7 5 0.58 9 3 0.75
Information Technology 10 2 0.83 6 6 0.50
Materials
7 5 0.58 6 6 0.50
Real Estate 5 7 0.42 4 8 0.33
Communication Services
7 5 0.58 4 8 0.33
Utilities
5 7 0.42 8 4 0.67
MSCI China
8 4 0.67 4 8 0.33
Hit Rate
64% 36%
2020
2021
of 79
5墨值下载
【版权声明】本文为墨天轮用户原创内容,转载时必须标注文档的来源(墨天轮),文档链接,文档作者等基本信息,否则作者和墨天轮有权追究责任。如果您发现墨天轮中有涉嫌抄袭或者侵权的内容,欢迎发送邮件至:contact@modb.pro进行举报,并提供相关证据,一经查实,墨天轮将立刻删除相关内容。
下载排行榜

评论