


Oracle19C性能调优,有OCP、OCM考点解析
25墨值下载
Oracle11g 性能调优 课堂笔记
第一部分 性能调优方法论
第一章:调优介绍
一、谁来调优
数据库管理员
应用架构师
应用设计师
应用开发人员
OS 系统管理员
存储系统管理员
二、DBA 在调优中做什么
1)应用调优(DBA 和开发人员合作)
SQL statement performance Change management
2)实例调优(DBA 负责)
MemoryDatabase structure
Instance configuration
3)操作系统(DBA 与系统管理员合作)
I/O
Swap
Parameters
三、调优方法论
OWI 全称 Oracle Wait Interface,即基于等待事件的调优方法。等待事件到 11g 已发展到近 1000 个。从 10g 开始,性能调优的
重点已经不再单纯是提高缓存击中率了。
OWI 是一种用于定位 process bottlenecks(即 wait events)的方式:
包括 I/O、locks、latches、bk process activities、network latencies 等等。它记录了所有这些事件的等待次数和总的等待时间。
在 OWI 之前,要定位问题必须将 checklist 上的所有项目都执行一遍,再根据经验判断问题所在,这往往浪费大量的时间而且容
易产生错误。
通过解除或者降低 Wait Events,可以直接提高系统工作效率。这些数据都被记录在动态视图中或 AWR 报告里。
Oracle 推荐使用 OWI 方法,通过等待事件的分析,直接消除问题。
调整目标具有三个特征:
1)具体的(Specific)
2)可测的(Measurable)
3)可实现的(Achievable)
OWI 方法论总结起来就是三点:
1)自顶向下,抓主要矛盾
2)选择可获得最大收益的事件入手
3)目标达到后见好就收
第二章:基本调优工具
一、性能调优工具
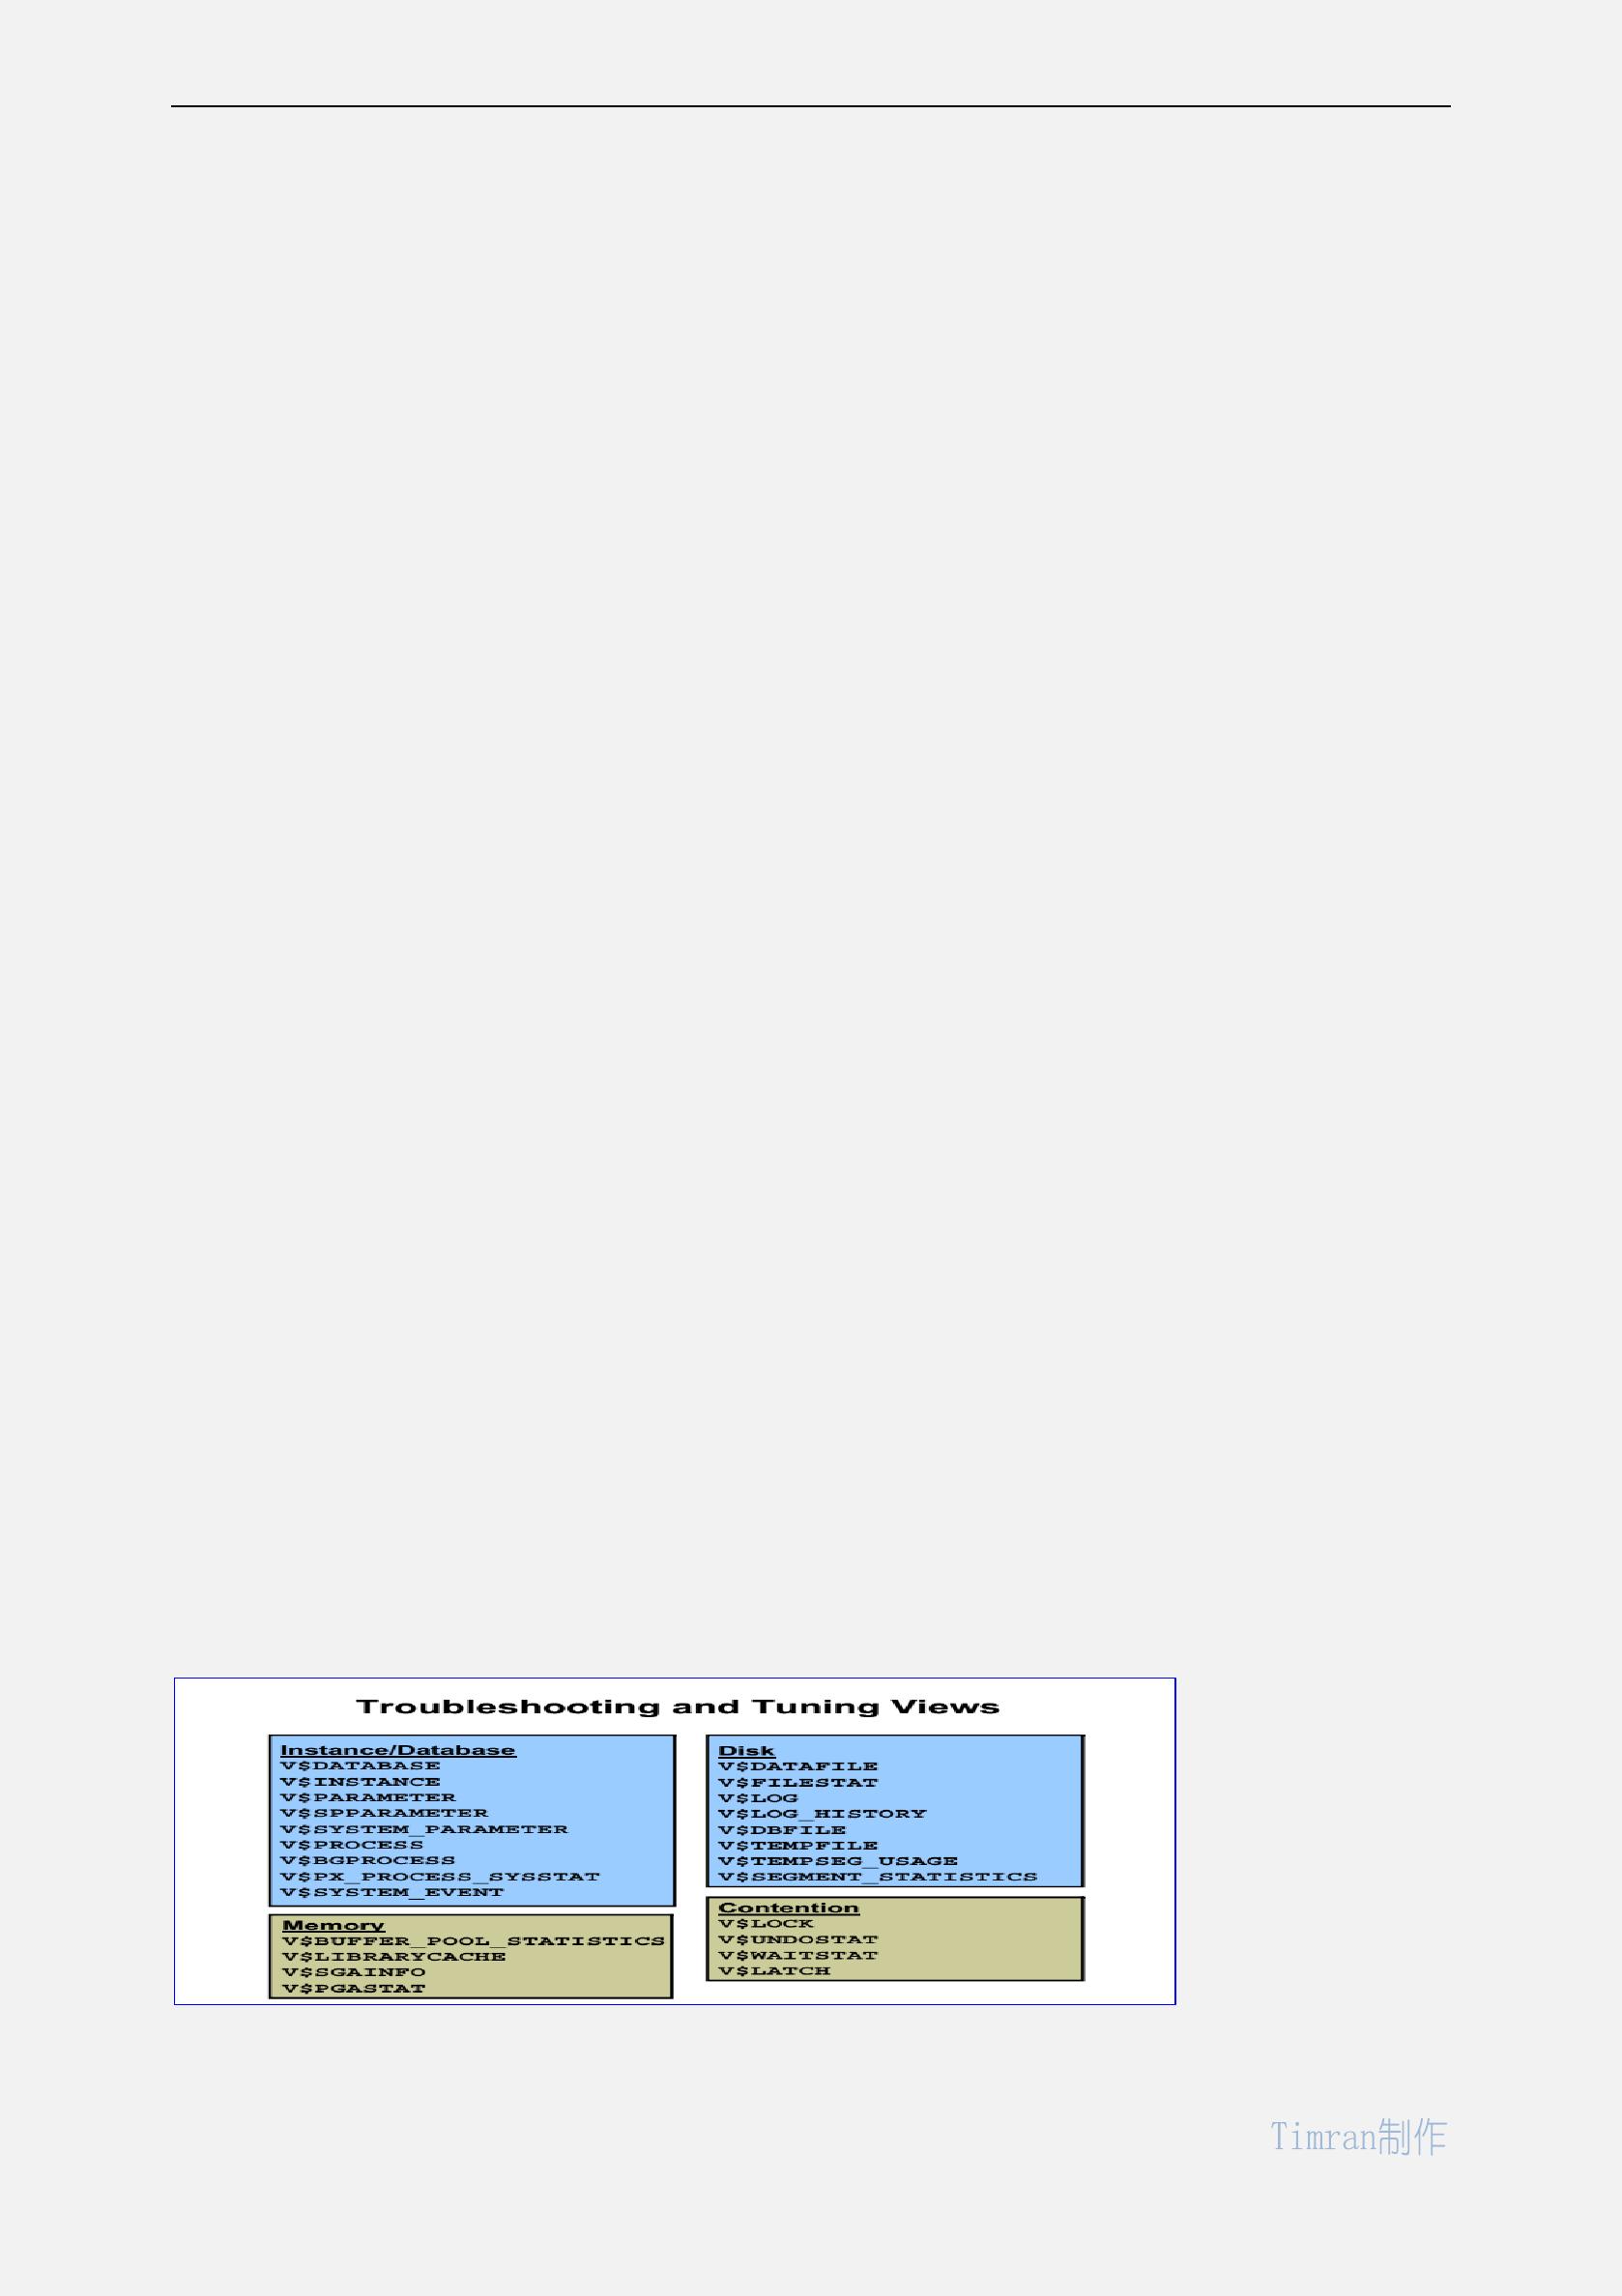
1)Dynamic performance views--动态性能视图
2 Load Profile--系统负荷
Instance Efficiency Percentages--实例效率
Advise statistics--顾问统计信息
Time Model Statistics--时间模型统计
Top wait events--突出的等待事件等等
SQL order by--主要 SQL 资源占用
3)告警日志
Alert log 文件和 Trace files 文件
4)Enterprise Manager Pages--OEM
5)诊断包和调优包
二、DB Time model
1、什么是 DB Time model
"The most important of the time model statistics is DB time. This statistics represents the total time spent in database calls and is a
indicator of the total instance workload. It is calculated by aggregating the CPU and wait times of all sessions not waiting on idle wait
events (non-idle user sessions). DB time is measured cumulatively from the time that the instance was started."
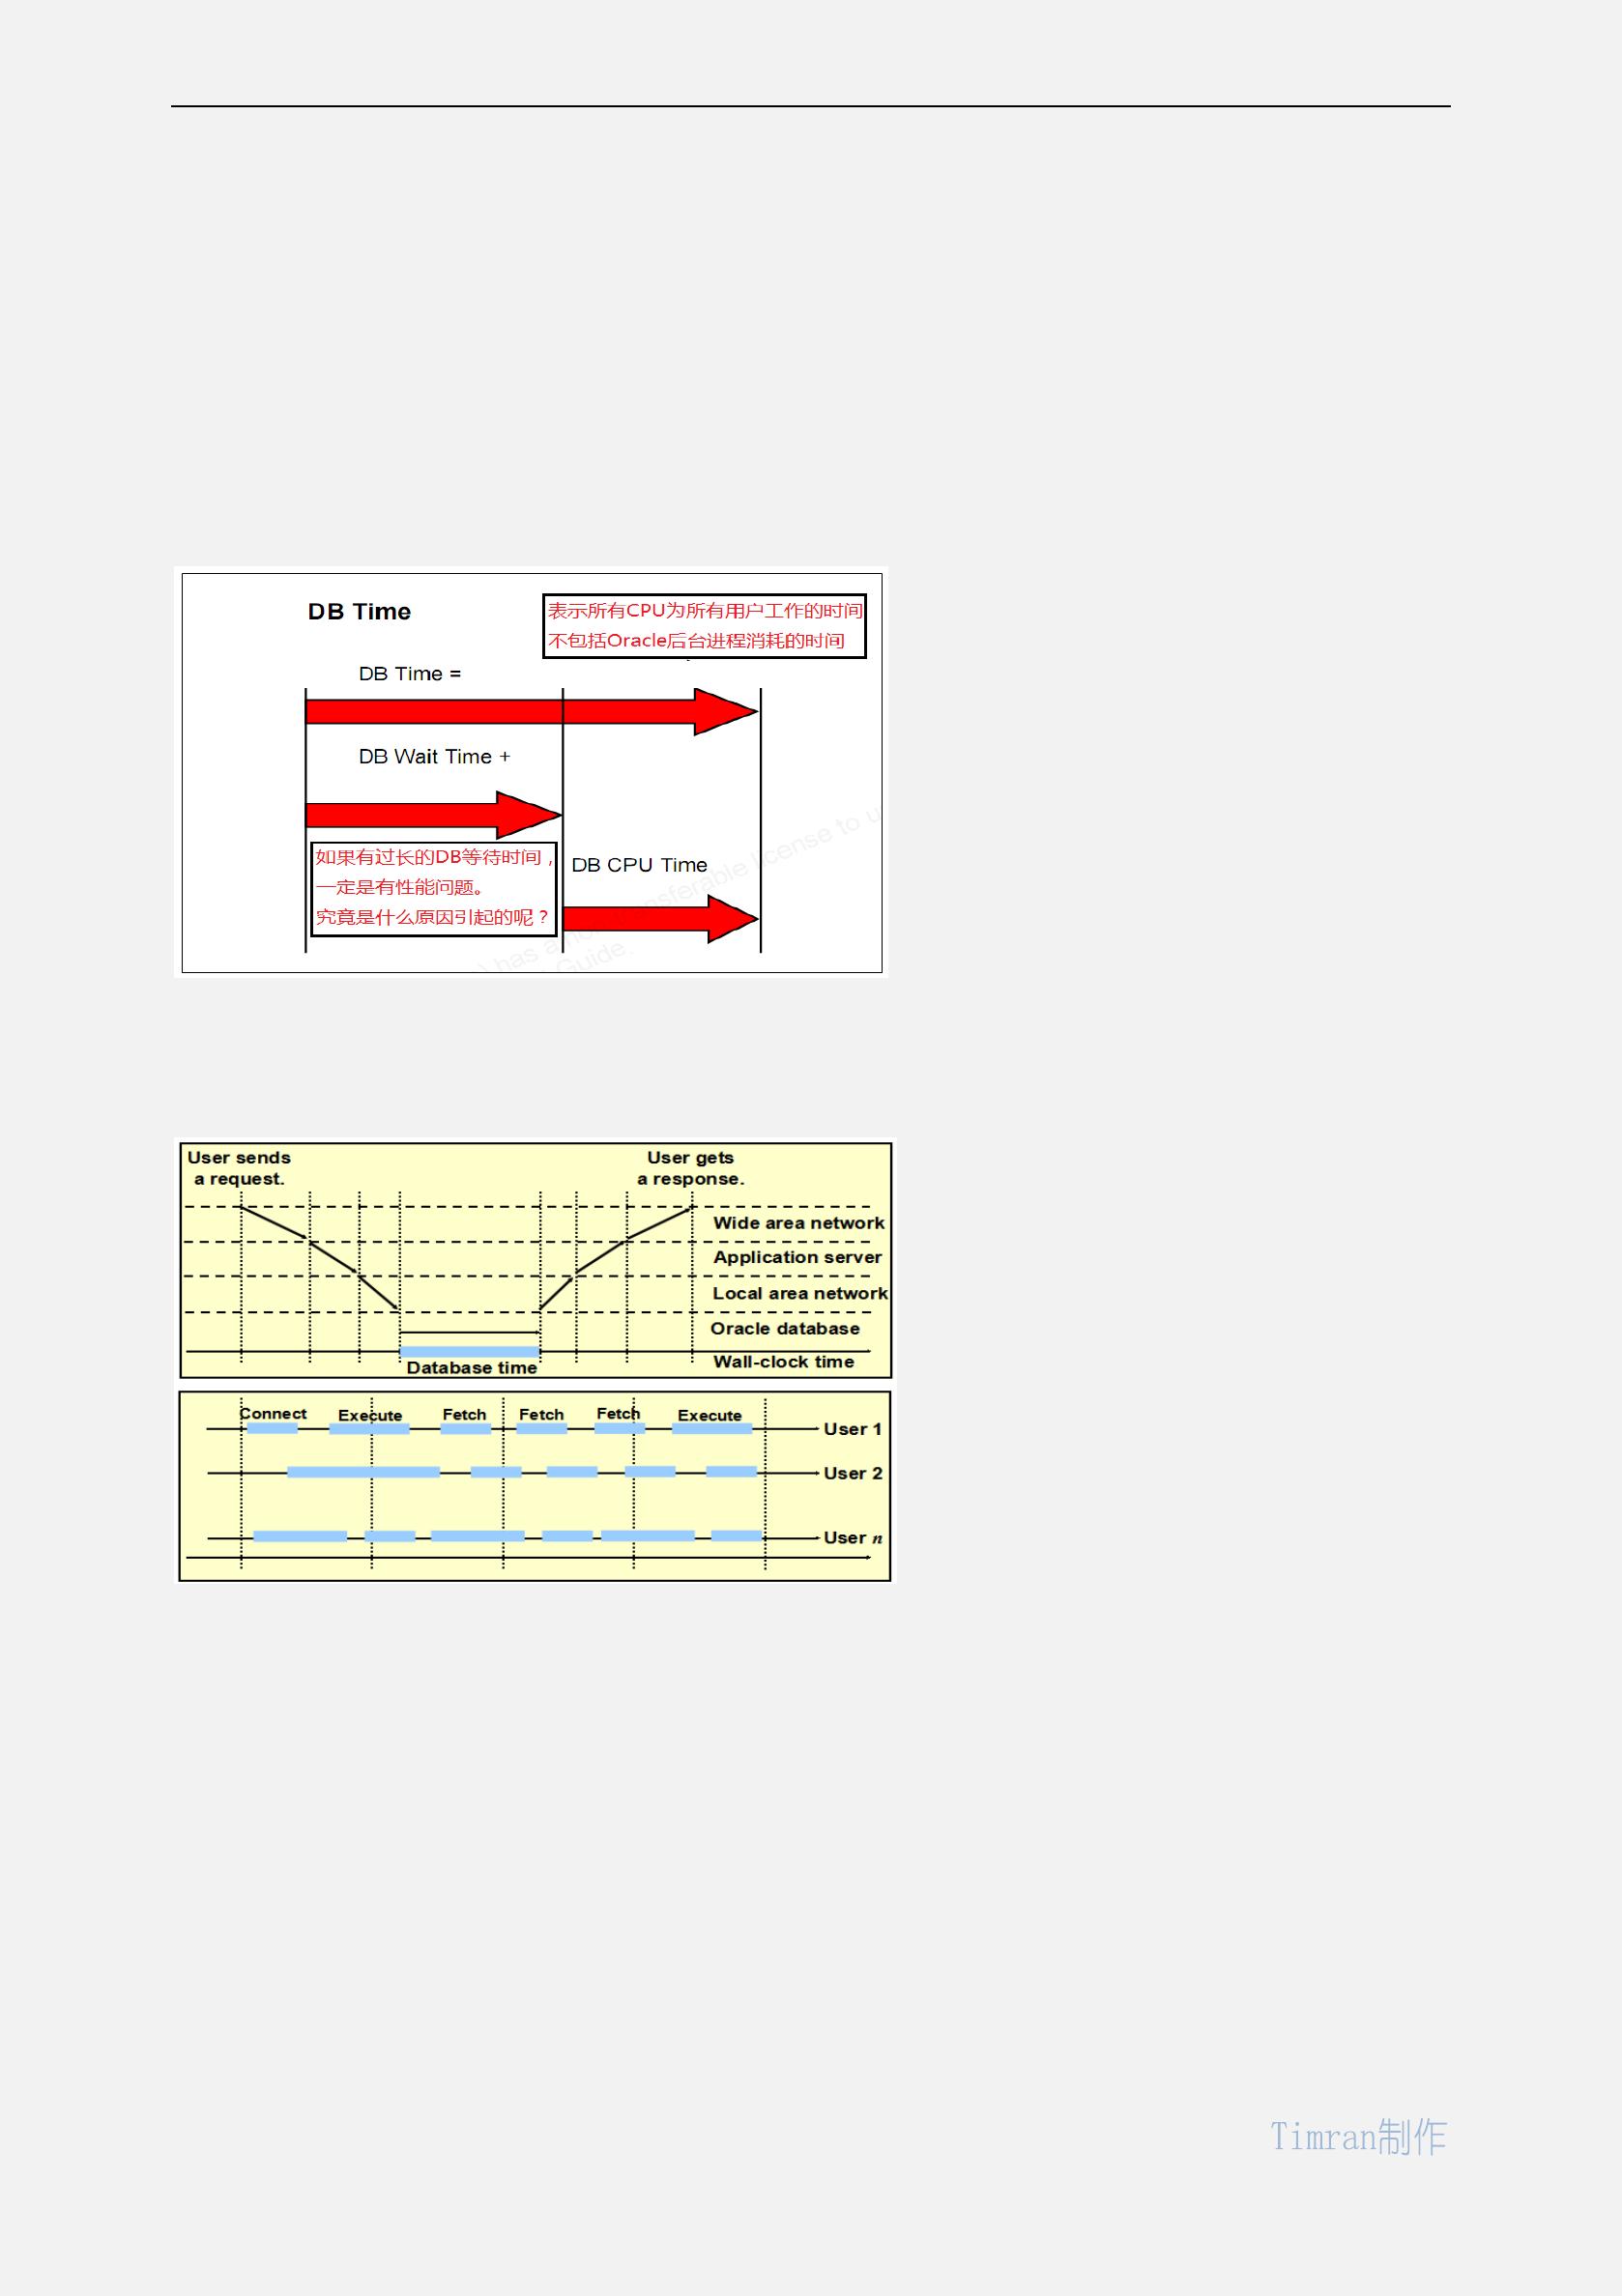
数据库消耗的总时间包括 DB time+background elapsed time
DB time 反应的是所有 user 使用的数据库资源的总和, 即:DB time=DB CPU+ DB Wait time(no-idle time)。
background elapsed time 指数据库后台进程消耗的时间,比如 PMON 进程本身,或 RMAN 备份恢复。
idle time 比如处于连接状态的空闲 session 不包括在 DB Wait time。
在一个正常的系统中一般来说 DB time 要远远大于 background elapsed time。
2、调优时,很重要的是把 DB Wait time(不包括 idle wait)和 DB CPU time 对比,看看谁占的比例大,这决定了多少时间是花
在有用的工作上,多少时间消耗在等待其他进程释放占用的资源。作为一般规则,调整 DB Wait time 比调整 DB CPU time 更为
迫切,然而,较高的 CPU time 也可能表明 SQL 本身写的很差。
而 Wait time 的急剧增加又可能反映了一个资源争用的迹象。
注意,资源争用通过增加更多的处理器,或集群节点,其作用往往是非常有限的,有时甚至可能适得其反。
在 DB time 的统计信息中,sql execute elapsed time 和 parse time elapsed 以及 DB CPU,这三项常常会占据 90%以上的 DB time,
而其中 sql execute elapsed time 又应该会在 95%以上,值得注意的是 DB CPU 和 sql execute elapsed time 是有交集的,因此你会
看到在一份 AWR 报告中有出现 DB CPU + sql execute elapsed time 超过 DB time 的情况。
of 55
25墨值下载
【版权声明】本文为墨天轮用户原创内容,转载时必须标注文档的来源(墨天轮),文档链接,文档作者等基本信息,否则作者和墨天轮有权追究责任。如果您发现墨天轮中有涉嫌抄袭或者侵权的内容,欢迎发送邮件至:contact@modb.pro进行举报,并提供相关证据,一经查实,墨天轮将立刻删除相关内容。
下载排行榜

评论