


BIGIP维护文档.doc
100墨值下载
1. F5 设备关键信息采集
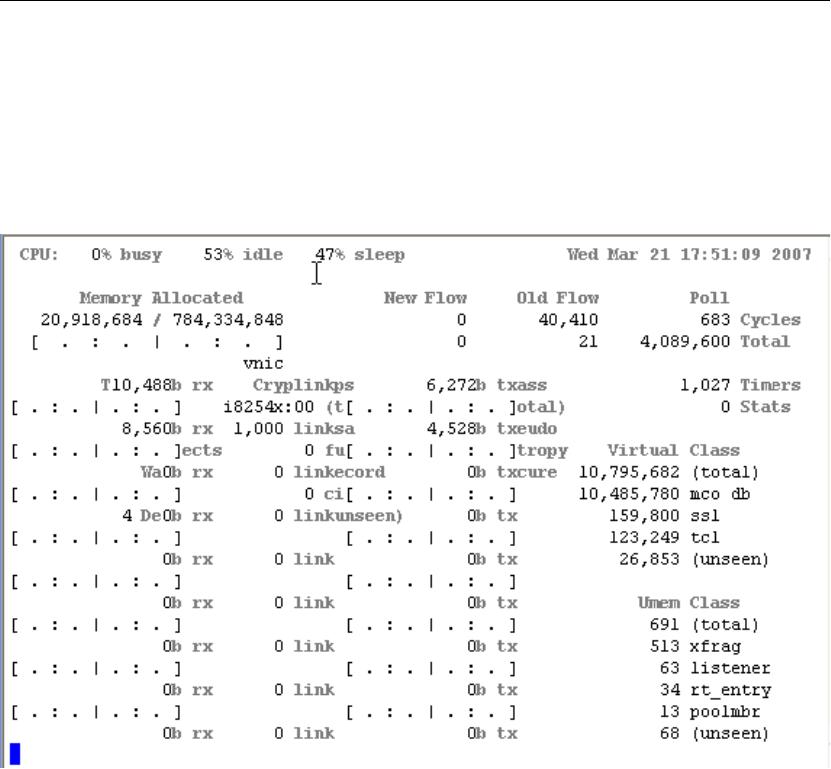
1.1 CPU 占用率获取
命令行:
#tmstat
在最顶上已行即是 CPU 占用率
通过 SNMP 系统进行获取的方式
采集以下值
total cycles (sysStatTmTotalCycles - .1.3.6.1.4.1.3375.2.1.1.2.1.41)
idle cycles (sysStatTmIdleCycles - .1.3.6.1.4.1.3375.2.1.1.2.1.42)和
sleep cycles(sysStatTmSleepCycles-.1.3.6.1.4.1.3375.2.1.1.2.1.43). 大 约 每 隔 10 秒
钟执行一次以上采集动作
2. 对每一个值,计算其增量
针对两次获取到的结果,示例如下
DeltaTmTotalCycles = sysStatTmTotalCycles2 - sysStatTmTotalCycles1
DeltaTmIdleCycles = sysStatTmIdleCycles2 - sysStatTmIdleCycles1
DeltaTmSleepCycles = sysStatTmSleepCycles2- sysStatTmSleepCycles1
3 然后根据以下公式计算 CPU 利用率:
CPUusage=((DeltaTmTotalCycles - (DeltaTmIdleCycles +DeltaTmSleepCycles)) /
DeltaTmTotalCycles) *100
最终的 CPUusage 则为该时段的平均 CPU 占用率。
1.2 内存占用率的获取
命令行:
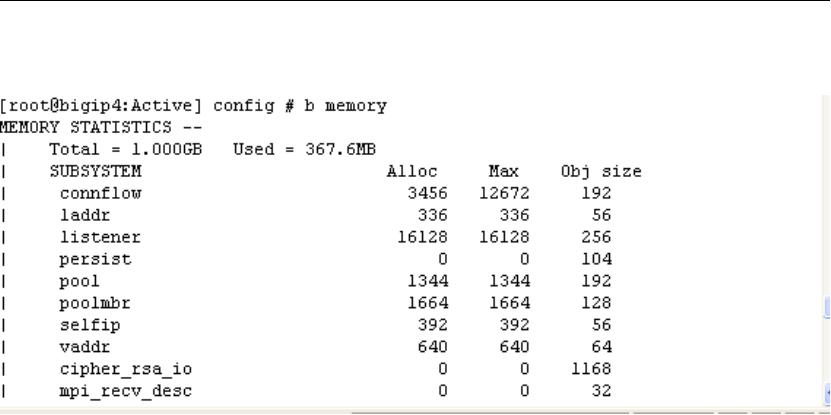
#b memory
显示结果的第一行包括系统的总内存数量和当前已经使用的内存数量
SNMP:
通过 OID sysStatMemoryUsed (.1.3.6.1.4.1.3375.2.1.1.2.1.45) 获取
测试命令及输出:
[root@bigip4:Active] config # snmpwalk -c public -v2c localhost -On .
1.3.6.1.4.1.3375.2.1.1.2.1.45
.1.3.6.1.4.1.3375.2.1.1.2.1.45.0 = Counter64: 384110592
1.3 系统总连接数:
命令行参数:
#b global show
输出如下:
[root@bigip1:Active] config # b global show
GLOBAL STATISTICS --
Client side
(cur, max, tot) = (32, 45, 244142) //此处为当前 Client 端的并发连接数
(pkts, bits) in = (719555, 424.4M), out = (342699, 403.0M)
PVA (cur, max, tot) = (0, 0, 0)
PVA (pkts, bits) in = (0, 0), out = (0, 0)
Server side
(cur, max, tot) = (32, 44, 234935) //此处为当前 Server 端的并发连接数
(pkts, bits) in = (716344, 422.7M), out = (139137, 315.1M)
PVA (cur, max, tot) = (0, 0, 0)
PVA (pkts, bits) in = (0, 0), out = (0, 0)
PVA connections (curr, tot) = (0, 0)
TMM cycles (total, idle, sleep) = (213.1T, 121.3T, 91.48T)
Denials (maint, addr full, serv full) = (0, 0, 0)
(no serv, no listen, no mem, no lic) = (0, 10150, 0, 0)
CPU (total, active, multi-mode) = (1, 1, UP)
Memory (total, used) = (768.0M, 196.3M)
of 14
100墨值下载
【版权声明】本文为墨天轮用户原创内容,转载时必须标注文档的来源(墨天轮),文档链接,文档作者等基本信息,否则作者和墨天轮有权追究责任。如果您发现墨天轮中有涉嫌抄袭或者侵权的内容,欢迎发送邮件至:contact@modb.pro进行举报,并提供相关证据,一经查实,墨天轮将立刻删除相关内容。
下载排行榜

评论