



Epilepsy EEG Classification Based on Convolution Support Vector Machine_Qi Xin.pdf
免费下载

Copyright © 2021 American Scientific Publishers
All rights reserved
Printed in the United States of America
RESEARCH ARTICLE
Journal of Medical Imaging and
Health Informatics
Vol. 11, 25–32, 2021
Epilepsy EEG Classification Based on Convolution
Support Vector Machine
Qi Xin
1
, Shaohai Hu
1 ∗
, Shuaiqi Liu
2 ∗
, Xiaole Ma
1
, Hui Lv
3
, and Yu-Dong Zhang
4 ∗
1
Institute of Information Science, Beijing Jiaotong Universi ty, Beijing 100044, China
2
College of Electronic and Information Engineering, Hebei University, Baoding Hebei 071002, China
3
Beagledata Technology (Beijing) Co., Ltd., Beijing, 100089, China
4
Department of Informatics, University of Leicester, Leicester, LE1 7RH, UK
Clinical Electroencephalogram (EEG) data is of great significance to realize automatable detection, recognition
and diagnosis to reduce the valuable diagnosis time. To make a classification of epilepsy, we constructed
convolution support vector machine (CSVM) by integrating the advantages of convolutional neural networks
(CNN) and support vector machine (SVM). To distinguish the focal and non-focal epilepsy EEG signals, we
firstly reduced the dimensionality of EEG signals by using principal component analysis (PCA). After that, we
classified the epilepsy EEG signals by the CSVM. The accuracy, sensitivity and specificity of our method reach
up to 99.56%, 99.72% and 99.52% respectively, which are competitive than the widely acceptable algor ithms.
The proposed automatic end to end epilepsy EEG signals classification algorithm provides a better reference
for clinical epilepsy diagnosis.
Keywords: EEG Signal Classification, PCA, CNN, SVM.
1. INTRODUCTION
The sudden unexpected electro-discharge of brain neurons will
bring to transience brain dysfunction, which is the mechanism
of epilepsy (a chronic illness) [1]. Epilepsy is caused by many
factors, such as genetic factors, cerebral diseases and system-
atic diseases. Epilepsy is the second most common destructive
nervous system disease [2], which affecting 0.4%∼1% of world
population [2]. One-third of epilepsy patients are not a vailable
to hav e appropriate medical treatment, and the treatment of the
remaining two-thirds varies according to the epilepsy status. Dur-
ing an epileptic seizure, the patient may have a slight temporal
clouding of consciousness or uncontrollable convulsions.
There are many clinical diagnostic methods for various dis-
eases, such as Magnetic Resonance Imaging for tumor, Diffu-
sion Tensor Imaging for neurodegenerative disorders, Computed
Tomography for orthopedic diseases and EEG [3]. The EEG-
based methods are mainly used for epilepsy detection in gen-
eral [4]. It has been demonstrated that there is significant
difference between the epileptic EEG and the normal one. The
cerebration of epilepsy includes ictal and inter-ictal periods, and
the change of EEG signals is obvious during the period of cyclic
transition, so EEG monitoring is the key measure to distinguish
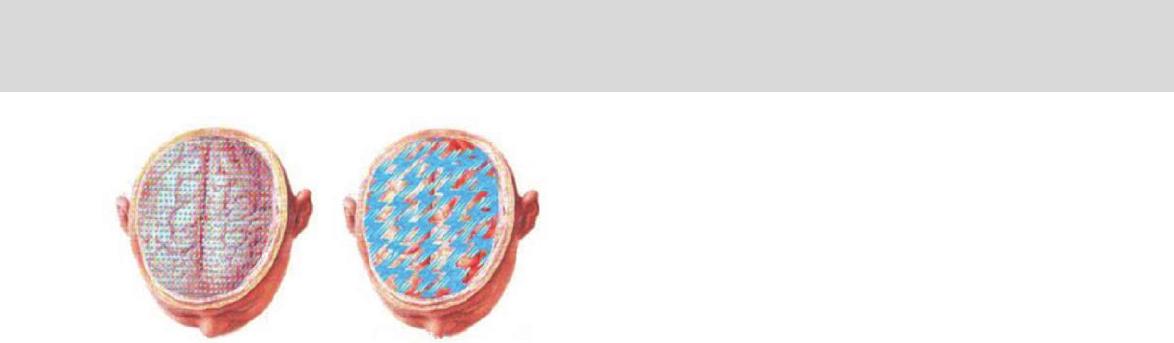
whether epileptic seizures or not [5]. Figure 1 gives the general
view of brain electrical activities of normal and epileptic seizures.
∗
Authors to whom correspondence should be addressed.
Clinically, epileptic patients are assessed with neurosurgical
treatment by e xcising the epileptic seizures brain regions. EEG
signal can be recorded from brain surface and even the deeper
brain structure in the process of some epileptic diagnosis. The
dynamic characteristics of these EEG records in ictal and inter-
ictal stages both provide valuable information for epileptogenic
focus location. At present, the epileptic diagnosis is carried out
by comprehensive analysis of the patient’s EEG, as well as symp-
toms, signs and other experimental results. However, manual
observation and detection of long-term EEG signals are complex
and time-consuming. Prolonged observ ation may cause fatigue of
medical personnel, which may easily lead to inaccurate manual
test results. Besides, professional experience is quite important in
manual observation [6], which demands the professional knowl-
edge of epilepsy for doctors. Therefore, the development of auto-
matic epileptic EEG signal classification algorithm is of great
significance. Recent research shows inter-disciplinary approach
can provide worthy diagnostic information for location of epilep-
tic focus under interictal and ictal period [7–9].
Since the 1960s, the automatic classification of epilepsy EEG
has attracted extensive research interest and a variety of auto-
matic detection methods in epilepsy are appeared. For instance,
the template matching based method proposed in Ref. [10] for
epilepsy identification taking the selected typical epilepsy signals
as a template and matching the detected waveform to identify
the disease. However, the diversity of EEG signals leads to great
J. Med. Imaging Health Inf. Vol. 11, No. 1, 2021 2156-7018/2021/11/025/008 doi:10.1166/jmihi.2021.3259 25
RESEARCH ARTICLE J. Med. Imaging Health Inf. 11, 25–32, 2021
Fig. 1. The general view of brain electrical activities of normal and epileptic
seizures.
difficulties in samples selection. Acharya distinguishes normal
EEG and epileptic EEG through nonlinear filtering [11]. Ho w-
ever, the false detection rate is higher if many false differences,
i.e. e y e movement, myoelectric, are existed in the EEG signals.
A frequency-domain and digital filter based EEG classification
algorithm is recommended to generate EEG reports automati-
cally in Ref. [12]. On the basis of the fluctuation of the fre-
quency range relative to the background employing wavelet, a
sensitive but less mis-detected method for epilepsy classification
is proposed [13]. Many researchers detect epilepsy by extracting
nonlinear EEG features. For example, in Ref. [14], Srinivasan
et al. put forward an epileptic EEG signal classification algo-
rithm by combining artificial neural networks and approximate
entropy. In Ref. [15], the authors presented an epilepsy classifi-
cation method based on Lyapunov index. In Ref. [16], Acharya
et al. used four different kinds of entropy to classify epileptic
seizure and achie ved good results. In Ref. [17], fuzzy entropy
and distributed entropy were used for epilepsy classification. In
Ref. [18], a new single feature called Tsallis entropy was used
for epilepsy classification, which greatly shortened t he detection
time. The rapid growth of expert system and fuzzy technology
has emphasized the field of epilepsy classification [18–20].
The synchronous mode of epilepsy is usually nonlinear, diverse
and uncertain, and there is difficulty in identifying the period of
epilepsy based on linear method. Therefore, the nonlinear adap-
tive pattern recognition is imperative. Deep learning can provide
nonlinear processing, adaptability and strong fault-tolerant for
signals. As deep learning has strong ability of automatic features
learning, it performs well in pattern recognition. As a deep learn-
ing model, CNN [21] is widely used in various signal processing
and image processing research fields. Similar to BP (Back Prop-
agation), the forward propagation is employed by CNN model to
calculate the output value, and it also uses back propagation to
adjust the weight and bias of the network. However, the biggest
difference between CNN and BP is that the neural units between
adjacent layers in CNN are partially connected, which are not
fully connected. That is, the sensory area of a certain neural
unit comes from the upper part of the neural units, instead of
being connected to all the neural units as BP does. Besides, as
a deep neural network structure, CNN does not have the same
incomputable problem as the traditional deep neural network.
The topological structure of data and the unkno wn parameters in
network can be solved by optimizing the network structure based
on the back-propagation algorithm. Therefore, CNN is widely
applied in various fields, such as signal denoising [22], signal
classification [23], machine health diagnosis [24] and cancer pre-
diction [25]. Recently, the classification of epilepsy based on
deep learning has been preliminarily entered on the scene. For
example, Ullah recommends the pyramid one-dimensional CNN
model to predict the types of EEG in epilepsy test data, and the
model simplifies the parameters of CNN.
Although CNN can be well applied for signal classification,
the training of CNN is time-consuming for large signal data.
To solve the problem, we firstly carry out principal component
analysis of EEG data and pick up the essential components of
EEG signals as the training and recognition features to accelerate
the CNN training process. Although the massive data guaran-
tees a good classification effect for CNN model, the CNN-based
classification algorithm does not get the desired effects if the
sample size is insufficient. Based on the structural risk mini-
mization, SVM can achieve better classification results with the
insufficient number. SVM is a new machine learning method to
find the maximum classification interval on account of the theory
of statistical learning [27]. SVM is a kind of machine learning
methods accorded with the structural risk minimization criterion.
It can obtain small errors after the training of a little training
set, and SVM can keep small errors to another stand-alone test
set. For classification, SVM gives the category of unknown sam-
ples by the decision surface of different classes in the region.
In Ref. [28], Siuly et al. presented an EEG signal classifica-
tion algorithm based on SVM. This algorithm applied LS-SVM
to class features that extracted by clustering in EEG data. This
algorithm performs well with the price of time-consuming. As a
commonly used supervised machine learning method in the field
of classification, SVM [29–31] can screen a few most effective
training samples for the prediction task from high-dimensional
data and it has a strong generalization ability, which can be used
for nonlinear classification.
To combine the advantages of CNN and SVM, a convolu-
tion support vector machine named CSVM is constructed for
the classification of focal and nonfocal in epilepsy EEG sig-
nals. CSVM is constructed by removing CNN’s soft-max layer
and directly cascading SVM. CSVM can classify epilepsy EEG
signals through CNN to extract the features of the principal
components after PCA. CSVM not only effectively increases
the accuracy of classification of epileptic EEG signals, but also
reduces the time of training and recognition, which is valuable
in clinical application.
2. THEORETICAL BASIS
2.1. Principal Component Analysis
In many research areas, researchers need to look for patterns in
the analyzed mass of data. What’s worse, the data to be analyzed
usually has multiple variables. While bringing a large amount of
information, the mass data also increases the workload of data
collection and processing, and the related variables also bring
challenges to the data processing. As the number of variables
decreases, the information contained in the data decreases to
some extent, we must find a feasible method to maintain the
main information and reduce the loss of information contained in
the original mass data. While reducing the index to be analyzed,
and PCA is a method which can reduce data dimensionality by
using eigenvectors based on multivariate statistical analysis. The
high-dimension eigenvectors is transformed into low-dimension
26
of 8
免费下载
【版权声明】本文为墨天轮用户原创内容,转载时必须标注文档的来源(墨天轮),文档链接,文档作者等基本信息,否则作者和墨天轮有权追究责任。如果您发现墨天轮中有涉嫌抄袭或者侵权的内容,欢迎发送邮件至:contact@modb.pro进行举报,并提供相关证据,一经查实,墨天轮将立刻删除相关内容。
下载排行榜

评论