

PostgreSQL高可用测试系列之Patroni + etcd + HAProxy + Keepalived 离线部署(七)
最近更新:2022-03-11 14:21:05
说明:本系列文章仅用于共享我的学习成果,未经过生产系统考验,对于知识点和一些组件的使用会不定时更新,仅供参考,如有错误的地方,欢迎留言共同学习。
-----------------------------
#### 本高可用系列测试不说理论知识,如有需要自行百度,因生产环境大多数是内网环境,无法连接互联网,为模拟生产环境安装,PostgreSQL高可用测试均采用离线部署。
#### 所需软件包均以打包上传百度网盘,如有需要自行下载:[https://pan.baidu.com/s/1Tb7GPMvj4kfKEIh8iyvdbA](https://pan.baidu.com/s/1Tb7GPMvj4kfKEIh8iyvdbA) 提取码:n9w2 文件名:PostgreSQL_HA.tar.gz
第一章: 介绍测试环境
第二章: PostgreSQL + replication 部署
第三章: Etcd 部署和管理
第四章: Patroni 部署和管理
第五章: HAProxy + Keepalived 部署和管理
第六章: 高可用模拟故障测试用例
第七章: Prometheus + Grafana 监控部署
第八章: 高可用管理
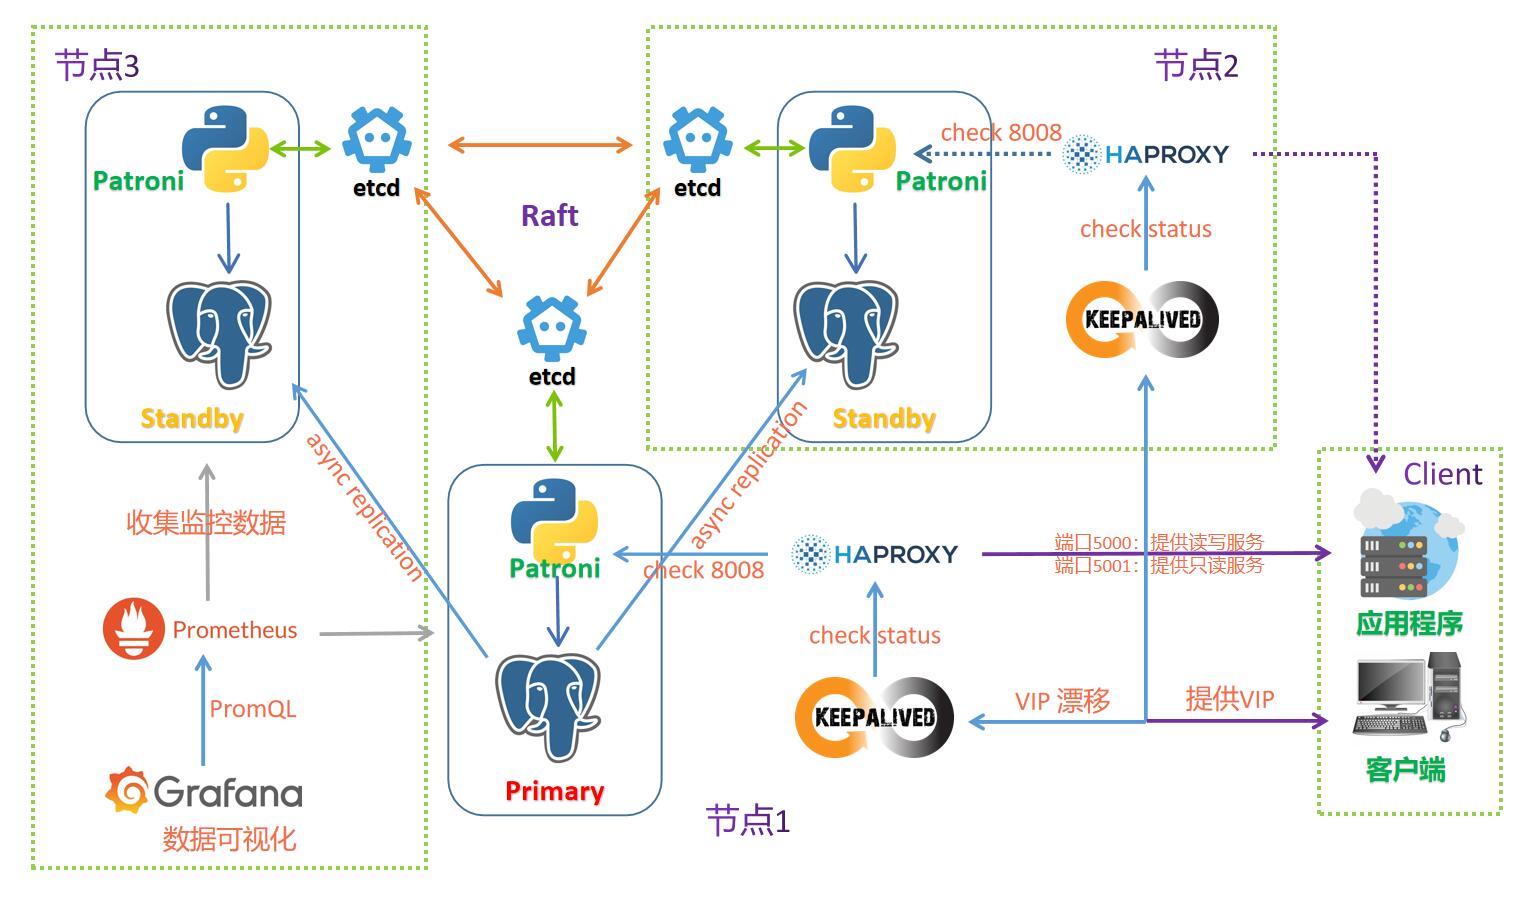
# 第七章: Prometheus + Grafana 监控部署
- **prometheus** github 下载地址:[https://github.com/prometheus/prometheus](https://github.com/prometheus/prometheus) 文件名:prometheus-2.30.3.linux-amd64.tar.gz
- **Grafana** 官网下载地址:[https://grafana.com/grafana/download](https://grafana.com/grafana/download) 文件名:grafana-enterprise-8.2.2.linux-amd64.tar.gz
prometheus用到的几个客户端数据采集工具:
- node_exporter github 下载地址:https://github.com/prometheus/node_exporter 文件名:node_exporter-1.2.2.linux-amd64.tar.gz
- postgres_exporter github 下载地址:https://github.com/prometheus-community/postgres_exporter 文件名:postgres_exporter-0.10.0.linux-amd64.tar.gz
- haproxy_exporter github 下载地址:https://github.com/prometheus-community/postgres_exporter 文件名:haproxy_exporter-0.12.0.linux-amd64.tar.gz
1. 在节点3上安装并启动prometheus
# 解压即是安装
[root@pgtest3 ~]# tar -zxvf /enmo/soft/prometheus-2.30.3.linux-amd64.tar.gz -C /enmo/app
......
登录MES账号 查看全文详情
登录/注册
