
Elasticsearch集群监控指标
最近更新:2023-10-20 09:34:33
前言
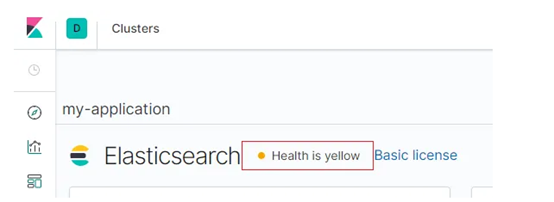
Elasticsearch 集群在运行的过程中,由于各种原因,经常会出现健康问题。比较直观的是:kibana监控、head插件监控显示集群非绿色(红色或者黄色)。
 或者通过命令查看健康状态:
http://192.168.2.135:9200/_cluster/health?pretty#
Elasticsearch集群监控状态指标解读
Elasticsearch集群监控状态指标分三个级别
- 集群级别:集群级别的监控主要是针对整个Elasticsearch集群来说,包括集群的健康状况、集群的状态等。
- 节点级别:节点级别的监控主要是针对每个Elasticsearch实例的监控,其中包括每个实例的查询索引指标和物理资源使用指标。
- 索引级别:索引级别的监控主要是针对每个索引来说,主要包括每个索引的性能指标。
Elasticsearch集群级别监控指标
- 查看集群健康状态(GET _cluster/health)
http://192.168.2.135:9200/_cluster/health?pretty#
{
  "cluster_name" : "elasticsearch",
  "status" : "green",
  "timed_out" : false,
  "number_of_nodes" : 8,
  "number_of_data_nodes" : 8,
  "active_primary_shards" : 373,
  "active_shards" : 752,
  "relocating_shards" : 0,
  "initializing_shards" : 0,
  "unassigned_shards" : 0,
  "delayed_unassigned_shards" : 0,
  "number_of_pending_tasks" : 0,
  "number_of_in_flight_fetch" : 0,
  "task_max_waiting_in_queue_millis" : 0,
  "active_shards_percent_as_number" : 100.0
}
关键指标说明:
- status:集群状态,分为green(每个索引的primary shard 和replica 都是active状态,ES集群正常)、yellow(每个索引的primary shard 是 active状态,但是部分的replica shard 不是active,ES集群可以正常使用)、red(不是所有索引的primary shard 都是active状态,部分索引数据丢失,集群不可用)......
登录MES账号 查看全文详情
登录/注册
