


prometheus监控elasticsearch,有很多的exporter可以选择,我们这里选用的是
https://github.com/vvanholl/elasticsearch-prometheus-exporter
主要原因是安装简单,是作为ES的插件形式安装。
第一步:下载安装插件
插件的版本需要和你的es的版本一致,下面以ES v7.6.2为例
./bin/elasticsearch-plugin install -b https://github.com/vvanholl/elasticsearch-prometheus-exporter/releases/download/7.6.2.0/prometheus-exporter-7.6.2.0.zip
安装完成之后,需要重启ES的节点,查看对应的metrics。
http://<your-elasticsearch-host>:9200/_prometheus/metrics
若无法在线安装,也可以离线安装,下载对应的release版本到es的plugin下。
第二步:prometheus配置
  - job_name: elasticsearch
    scrape_interval: 10s
    metrics_path: "/_prometheus/metrics"
    basic_auth:
      username: xxx
      password: xxx
    static_configs:
      - targets:
        - 192.168.3.80:9200
        - 192.168.3.80:9210
        - 192.168.3.80:9220
        - 192.168.3.81:9200
        - 192.168.3.82:9200
        - 192.168.3.81:9210
        - 192.168.3.82:9210
        - 192.168.3.81:9220
        - 192.168.3.82:9220
第三步:grafana添加模板
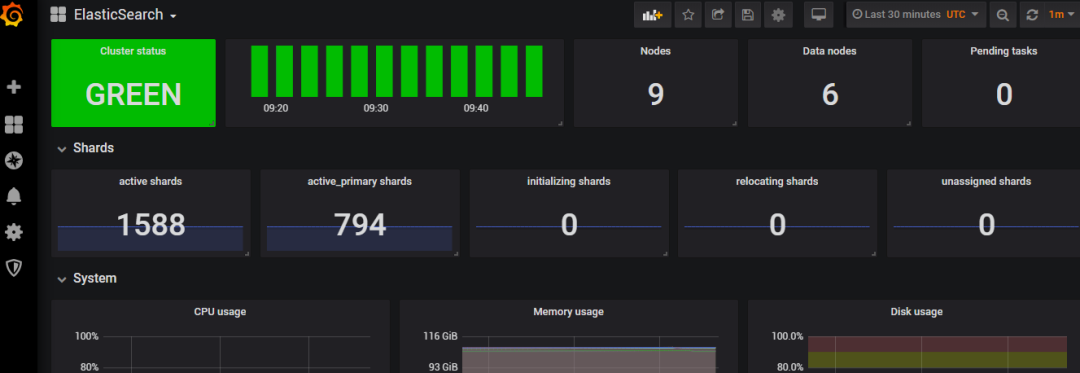
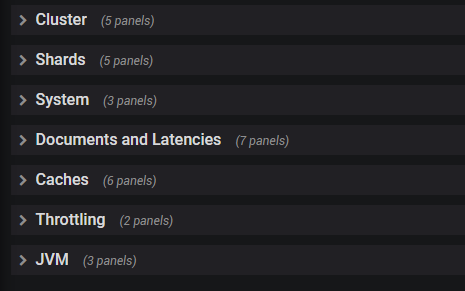
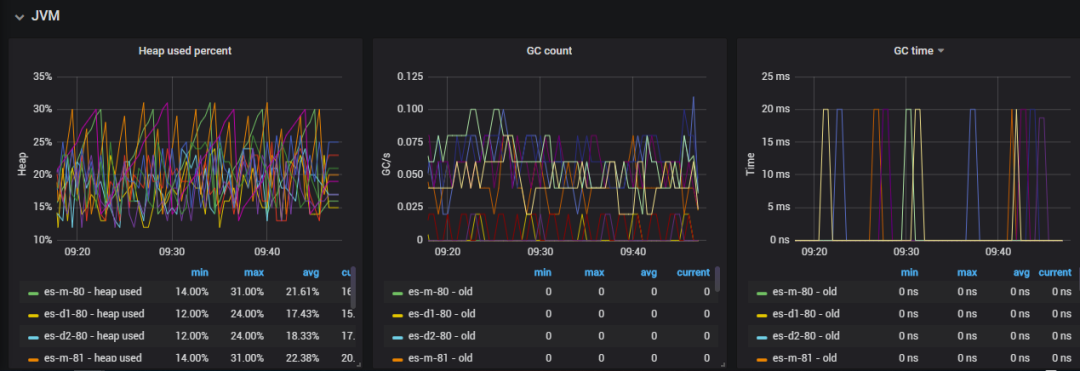
导入模板 266

此dashboard的资源还是非常丰富的,具体截图如下:
第四步:配置告警模板
暂时略过(^_^)

文章转载自运维笔谈,如果涉嫌侵权,请发送邮件至:contact@modb.pro进行举报,并提供相关证据,一经查实,墨天轮将立刻删除相关内容。
