TiDB是NewSQL数据库的技术探路者和引领者,本文简要介绍了TiDB的组件TiDB Server、PD调度和TiKV,并使用TiUP搭建了三节点的TiDB集群环境,部署简单便捷。
1、TiDB基本概念
TiDB是PingCAP公司自主设计、研发的开源分布式关系型数据库,是一款同时支持OLTP和OLAP业务的融合型分布式数据库产品,具备水平扩容或者缩容、金融级高可用、实时HTAP、云原生的分布式数据库、同时兼容MySQL 5.7协议和MySQL生态等重要特性。
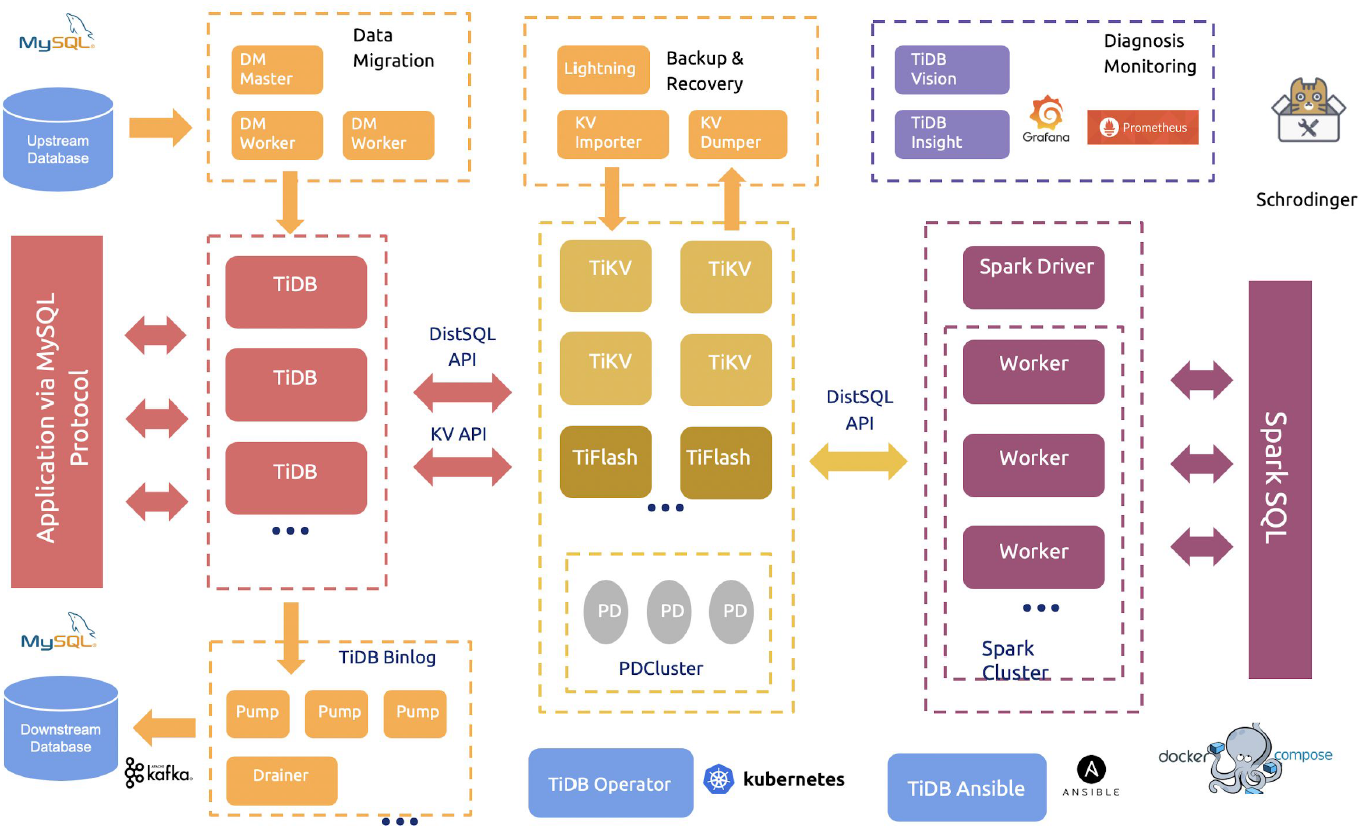
如图是TiDB整体架构图,可以看到TiDB核心功能组件包括:
- 计算层TiDB Server,负责与客户端通信,执行SQL解析和优化
- 存储层TiKV和TiFlash,支持key-value键值对存储和列式存储
- 调度层PDCluster,整个集群的大脑,负责分发调度指令给TiKV
- 分析计算模块TiSPARK,与Spark集群进行联动
- 云原生架构,基于K8S实现容器云平台的自动化部署和运维
- 通过TiDB Binlog实现MySQL数据库的实时同步
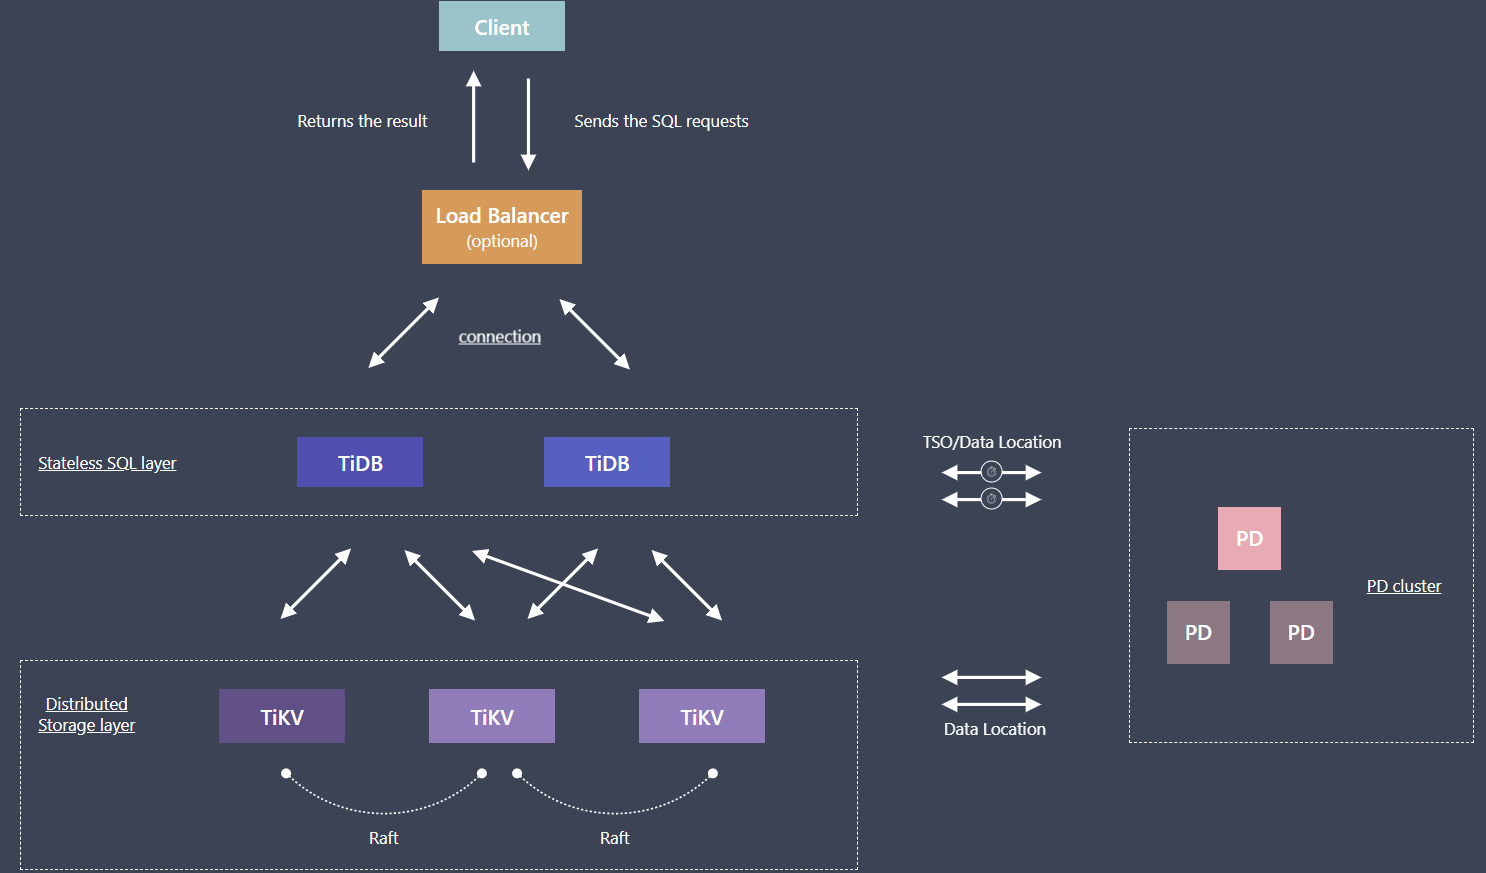
TiDB执行流程如图所示:
- 用户的SQL请求会直接或者通过 Load Balancer发送到TiDB Server
- TiDB Server会解析MySQL Protocol Packet,获取请求内容,对SQL进行语法解析和语义分析,制定和优化查询计划,执行查询计划并获取和处理数据
- PD server根据TiKV节点实时上报的数据分布状态,下发数据调度命令给具体的TiKV节点
- 数据全部存储在TiKV集群中, TiKV根据SQL请求返回数据到TiDB Server
- 最后TiDB Server需要将查询结果返回给用户。
1.1 TiDB Server
TiDB Server是SQL层,对外暴露MySQL协议的连接endpoint,负责接受客户端的连接,执行 SQL 解析和优化,最终生成分布式执行计划。TiDB层本身是无状态的,TiDB Server本身并不存储数据,只是解析 SQL,将实际的数据读取请求翻译成key-value操作转发给底层的存储节点 TiKV(或 TiFlash),最终查询结果返回给客户端。
SQL层架构如下所示:
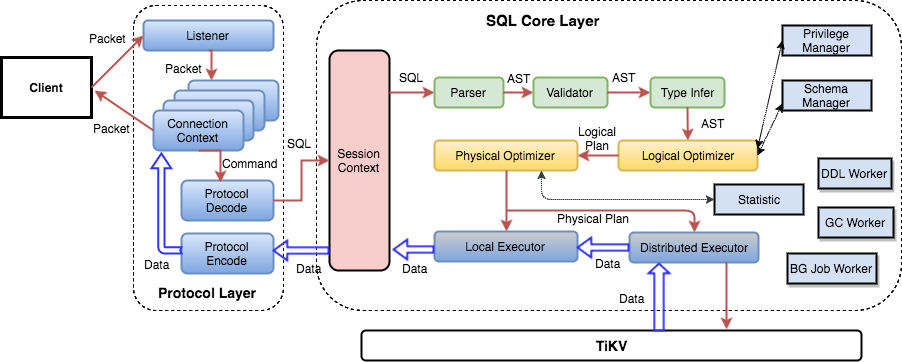
用户的SQL请求会直接或者通过 Load Balancer发送到TiDB Server,TiDB Server会解析MySQL Protocol Packet,获取请求内容,对SQL进行语法解析和语义分析,制定和优化查询计划,执行查询计划并获取和处理数据。数据全部存储在TiKV集群中,所以在这个过程中TiDB Server需要和TiKV交互,获取数据。最后 TiDB Server需要将查询结果返回给用户。
1.2 PD Server
PD server是整个TiDB集群的元信息管理模块,负责存储每个TiKV节点实时的数据分布情况和集群的整体拓扑结构,提供TiDB Dashboard管控界面,并为分布式事务分配事务 ID。PD不仅存储元信息,同时还会根据TiKV节点实时上报的数据分布状态,下发数据调度命令给具体的TiKV节点,可以说是整个集群的“大脑”。
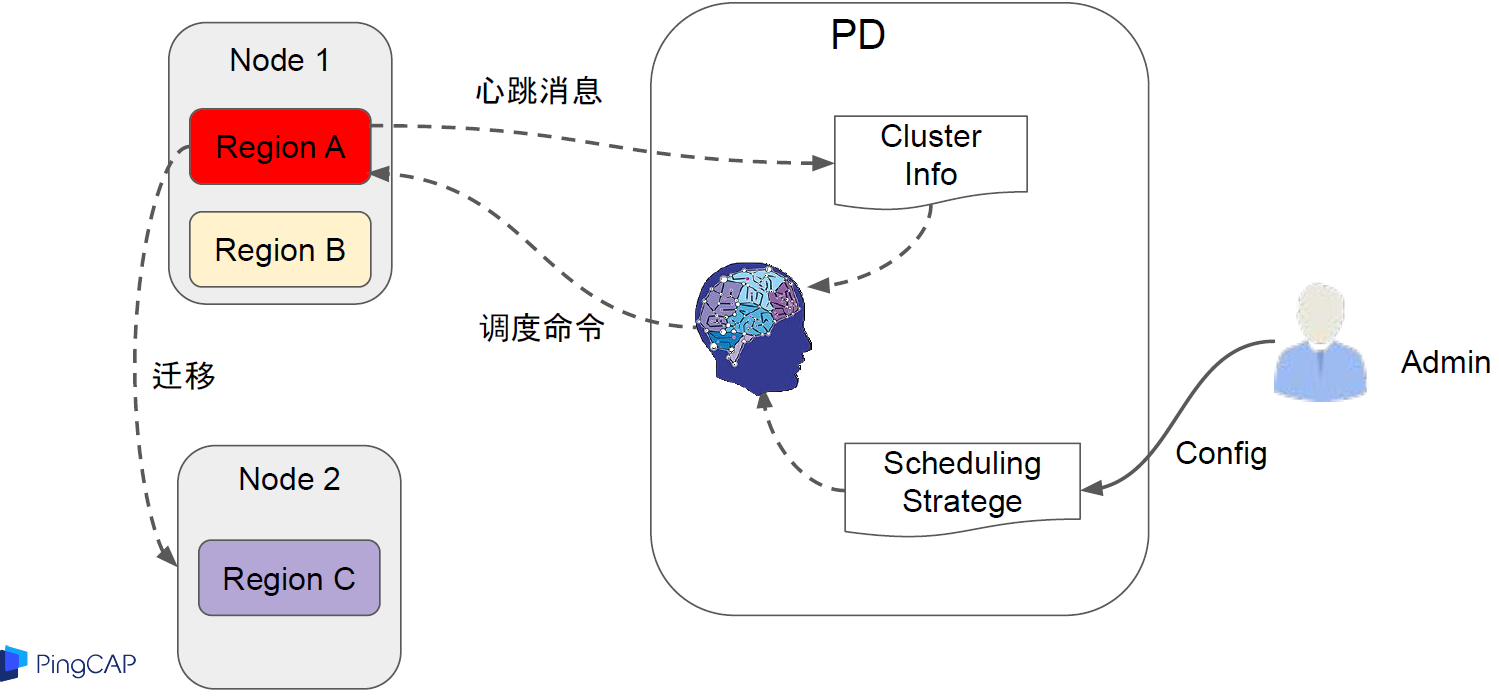
- 调度信息的收集
调度依赖于整个集群信息的收集,简单来说,调度需要知道每个TiKV节点的状态以及每个 Region的状态。TiKV集群会以心跳包的形式定期向PD汇报两类消息,TiKV节点信息和Region信息:
- 每个TiKV节点会定期向PD汇报节点的状态信息,包括磁盘容量、承载的Region数量、数据写入/读取速度、发送/接收的Snapshot数量、是否过载等
- 每个Raft group leader会定期向PD汇报Region状态信息,包括Leader的位置、Followers的位置、掉线Replica的数量、数据写入/读取速度等
- 调度的策略
PD在收集到信息后,会根据一些调度策略来制定具体的调度计划:
- Region中副本的数量,当发现副本数量不满足Raft算法要求时,需要通过ADD或Remove副本来调整副本数量
- Raft Group中多个副本不在同一个位置,一般情况下PD只会保证多个副本不会落在同一个节点上,以避免单个副本失效导致多个副本丢失
- 副本在存储之间均匀分配,使得各节点之间承载的数据更均衡
- Leader数量在存储之间均匀分配,Raft协议要求读写都是在leader上完成,因此PD会尽量保证leader在节点之间分散开
- 访问热点数据在存储间均匀分配,PD会检测出访问热点,并将其在节点之间分散开
- 各个存储的空间使用大致相等,PD在调度时候会考虑节点的存储空间剩余量
- 控制调度速度,避免影响在线服务,调度操作需要耗费CPU、内存、磁盘IO以及网络带宽,PD会对当前正在进行的操作数量进行控制
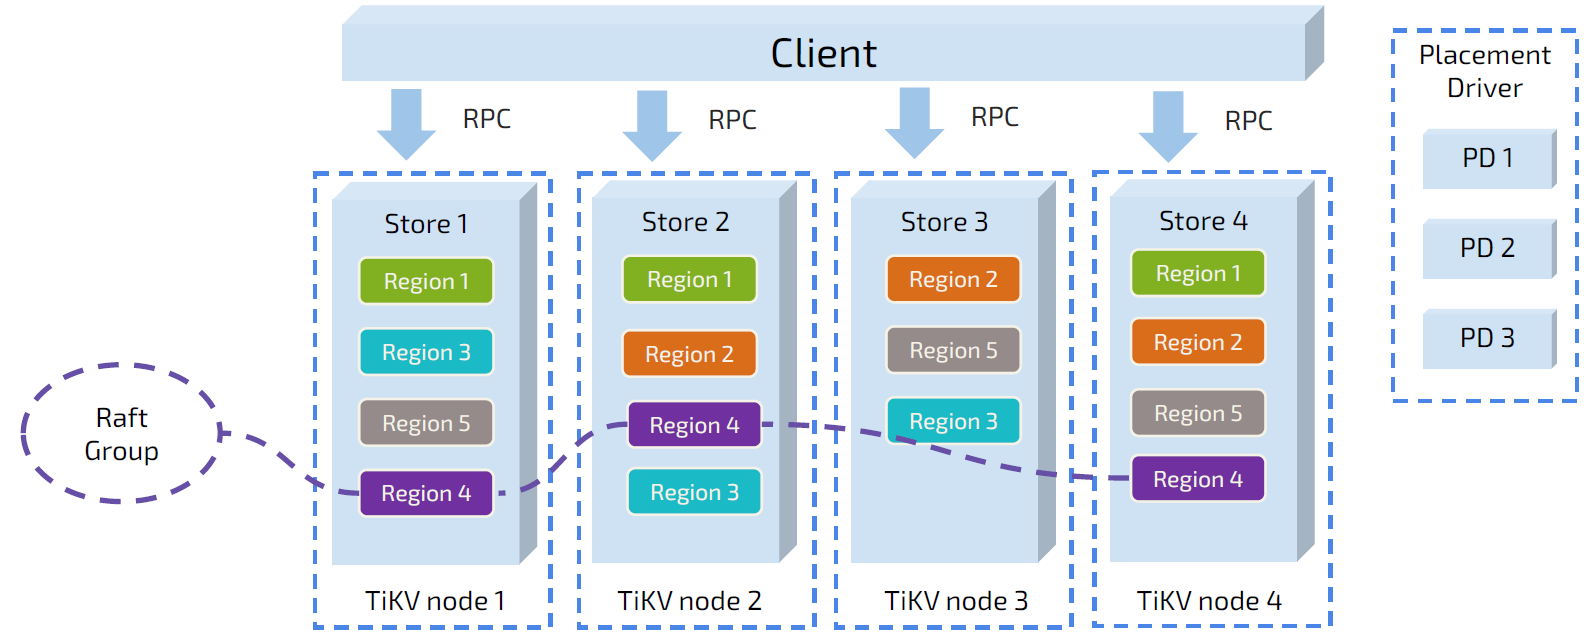
1.3 TiKV存储
TiKV负责存储数据,从外部看TiKV是一个分布式的提供事务的Key-Value存储引擎。存储数据的基本单位是Region,每个Region负责存储一个Key Range(从 StartKey 到 EndKey 的左闭右开区间)的数据,每个TiKV节点会负责多个Region。TiKV的API在KV键值对层面提供对分布式事务的原生支持,默认提供了SI (Snapshot Isolation)的隔离级别,这也是TiDB在SQL层面支持分布式事务的核心。TiDB的SQL层做完SQL解析后,会将SQL的执行计划转换为对TiKV API的实际调用。
- Key-value键值对
TiDB采用Key-Value模型存储数据,key-value键值对是一个巨大的map,这个map会按照key的二进制顺序有序排列。
- 存储引擎RocksDB
TiDB没有直接向磁盘上写数据,而是把数据保存在RocksDB中,具体的数据落地由RocksDB负责。RocksDB 是由Facebook开源的一个非常优秀的单机KV存储引擎,可以满足TiKV对单机引擎的各种要求。这里可以简单的认为RocksDB是一个单机的持久化Key-Value Map。
- Region
TiKV将整个key-value空间分成很多段,每一段是连续的key,这些段称为region,目前TiKV中默认Region大小是96MB。TiKV会以region为单位,将数据分散在集群的所有节点上,并且保证每个节点上服务的Region数量差不多,并且以Region为单位做Raft的复制和成员管理。这样做有以下好处:
- TiDB中的PD调度系统会将Region数据尽可能的分布在不同的节点上,可以实现存储数据的水平扩展和负载均衡。同时PD也会记录Region在节点中的分布情况,也就是通过任意一个key就可以查到这个key在哪个region上
- TiKV以Region为单位做数据的复制,这样一个Region的数据会保存多个副本,副本之间通过Raft来保证数据的一致性。一个Region的多个副本会保存在不同的节点上,构成一个Raft Group。其中一个副本会作为这个Group的Leader,其他的副本作为Follower。默认情况下,所有的读和写都是通过Leader进行,读操作在Leader上即可完成,而写操作再由Leader复制给Follower。
- 多版本控制MVCC
TiKV的MVCC是通过在key后面添加版本号实现的,没有MVCC之前,可以把TiKV看做这样的:
Key1 -> Value
Key2 -> Value
……
KeyN -> Value
有了MVCC之后,TiKV的Key排列是这样的:
Key1_Version3 -> Value
Key1_Version2 -> Value
Key1_Version1 -> Value
……
Key2_Version4 -> Value
Key2_Version3 -> Value
Key2_Version2 -> Value
Key2_Version1 -> Value
……
KeyN_Version2 -> Value
KeyN_Version1 -> Value
……
2、TiDB集群环境部署
2.1 环境准备
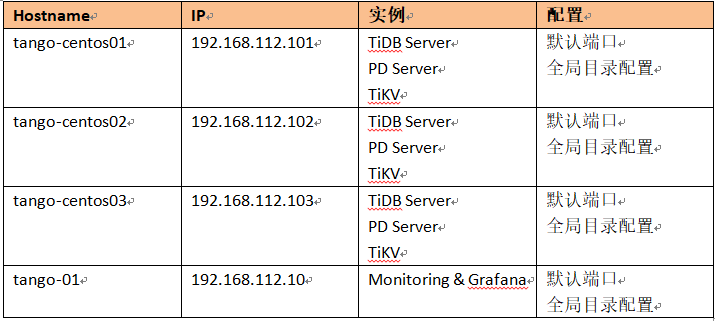
1)服务器列表
TiDB集群最小部署环境需要3个节点,这里将TiDB Server、PD Server和TiKV放在一台虚机上共3台主机,另外一个主机部署控制台和监控节点。
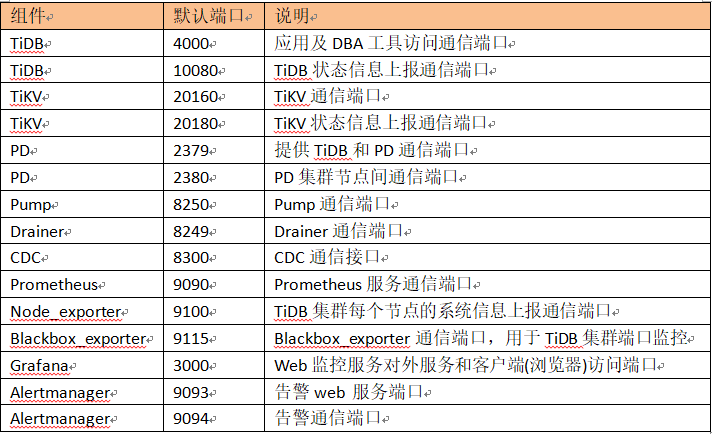
TiDB默认端口信息如下:
2)检测及关闭系统SWAP
TiDB运行需要有足够的内存,并且不建议使用swap作为内存不足的缓冲,这会降低性能。因此建议永久关闭系统 swap,并且不要使用 swapoff -a 方式关闭,否则重启机器后该操作会失效。
[root@tango-centos01 ~]#echo "vm.swappiness = 0">> /etc/sysctl.conf
[root@tango-centos01 ~]#swapoff -a && swapon -a
[root@tango-centos01 ~]#sysctl -p
3)检测及关闭防火墙
[root@tango-centos01 ~]# systemctl status firewalld.service
â— firewalld.service - firewalld - dynamic firewall daemon
Loaded: loaded (/usr/lib/systemd/system/firewalld.service; disabled; vendor preset: enabled)
Active: inactive (dead)
Docs: man:firewalld(1)
如果没有关闭,需使用以下命令关闭
sudo systemctl stop firewalld.service
sudo systemctl disable firewalld.service
4)检测及安装NTP
TiDB 是一套分布式数据库系统,需要节点间保证时间的同步,从而确保 ACID 模型的事务线性一致性。目前解决授时的普遍方案是采用 NTP 服务,可以通过互联网中的 pool.ntp.org 授时服务来保证节点的时间同步,也可以使用离线环境自己搭建的 NTP 服务来解决授时。在CentOS 7系统上手动安装 NTP 服务,可执行以下命令:
[root@tango-centos01 ~]# sudo yum install ntp ntpdate
[root@tango-centos01 ~]# sudo systemctl start ntpd.service
[root@tango-centos01 ~]# sudo systemctl enable ntpd.service
查看NTP状态
[root@tango-centos01 ~]# sudo systemctl status ntpd.service
â— ntpd.service - Network Time Service
Loaded: loaded (/usr/lib/systemd/system/ntpd.service; enabled; vendor preset: disabled)
Active: active (running) since Sun 2020-11-15 17:06:29 CST; 25s ago
Main PID: 1582 (ntpd)
CGroup: /system.slice/ntpd.service
└─1582 /usr/sbin/ntpd -u ntp:ntp -g
[root@tango-centos01 ~]# ntpstat
synchronised to NTP server (119.28.206.193) at stratum 3
time correct to within 957 ms
polling server every 64 s
4)创建用户tidb并设置SUDO免密登录
[root@tango-centos01 ~]# useradd -d /home/tidb tidb
[root@tango-centos01 ~]# passwd tidb
修改sudo权限
[root@tango-centos01 ~]# visudo
## Same thing without a password
# %wheel        ALL=(ALL)       NOPASSWD: ALL
%tidb        ALL=(ALL)       NOPASSWD: ALL
2.2 TiUP离线部署TiDB集群
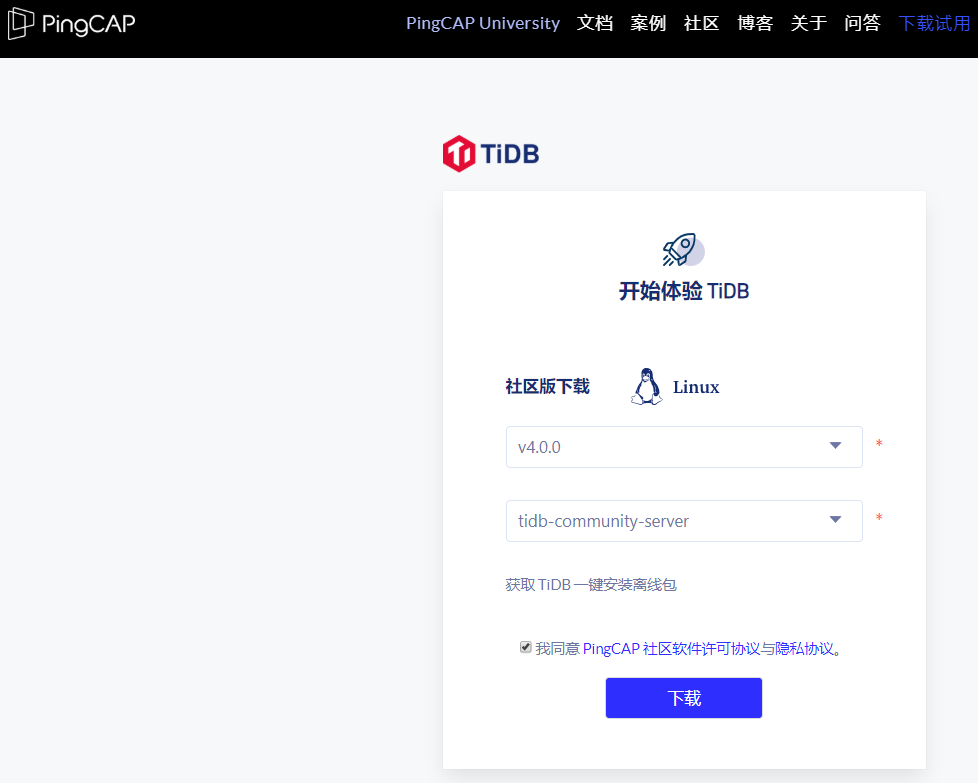
1)下载TiDB安装包
下载地址为https://pingcap.com/download-cn/community/,选择4.0版本
2)将离线包发送到目标集群的中控机后,执行以下命令安装 TiUP 组件:
[root@tango-01 src]# tar -xzvf tidb-community-server-v4.0.0-linux-amd64.tar.gz
[root@tango-01 src]# sh tidb-community-server-v4.0.0-linux-amd64/local_install.sh
Set mirror to /usr/local/src/tidb-community-server-v4.0.0-linux-amd64 success
Detected shell: bash
Shell profile:  /root/.bash_profile
/root/.bash_profile has been modified to to add tiup to PATH
open a new terminal or source /root/.bash_profile to use it
Installed path: /root/.tiup/bin/tiup
===============================================
1. source /root/.bash_profile
2. Have a try:   tiup playground
===============================================
[root@tango-01 src]# source /root/.bash_profile
local_install.sh 脚本会自动执行 tiup mirror set tidb-community-server-v4.0.0-linux-amd64 ,命令将当前镜像地址设置为 tidb-community-server-v4.0.0-linux-amd64。若需将镜像切换到其他目录,可以通过手动执行 tiup mirror set
3)配置初始化参数文件topology.yaml
[root@tango-01 src]# vi topology.yaml
# # Global variables are applied to all deployments and used as the default value of
# # the deployments if a specific deployment value is missing.
global:
  user: "tidb"
  ssh_port: 22
  deploy_dir: "/tidb-deploy"
  data_dir: "/tidb-data"

server_configs:
  pd:
    replication.enable-placement-rules: true

pd_servers:
  - host: 192.168.112.101
  - host: 192.168.112.102
  - host: 192.168.112.103
tidb_servers:
  - host: 192.168.112.101
  - host: 192.168.112.102
  - host: 192.168.112.103
tikv_servers:
  - host: 192.168.112.101
  - host: 192.168.112.102
  - host: 192.168.112.103
monitoring_servers:
  - host: 192.168.112.10
grafana_servers:
  - host: 192.168.112.10
alertmanager_servers:
  - host: 192.168.112.10
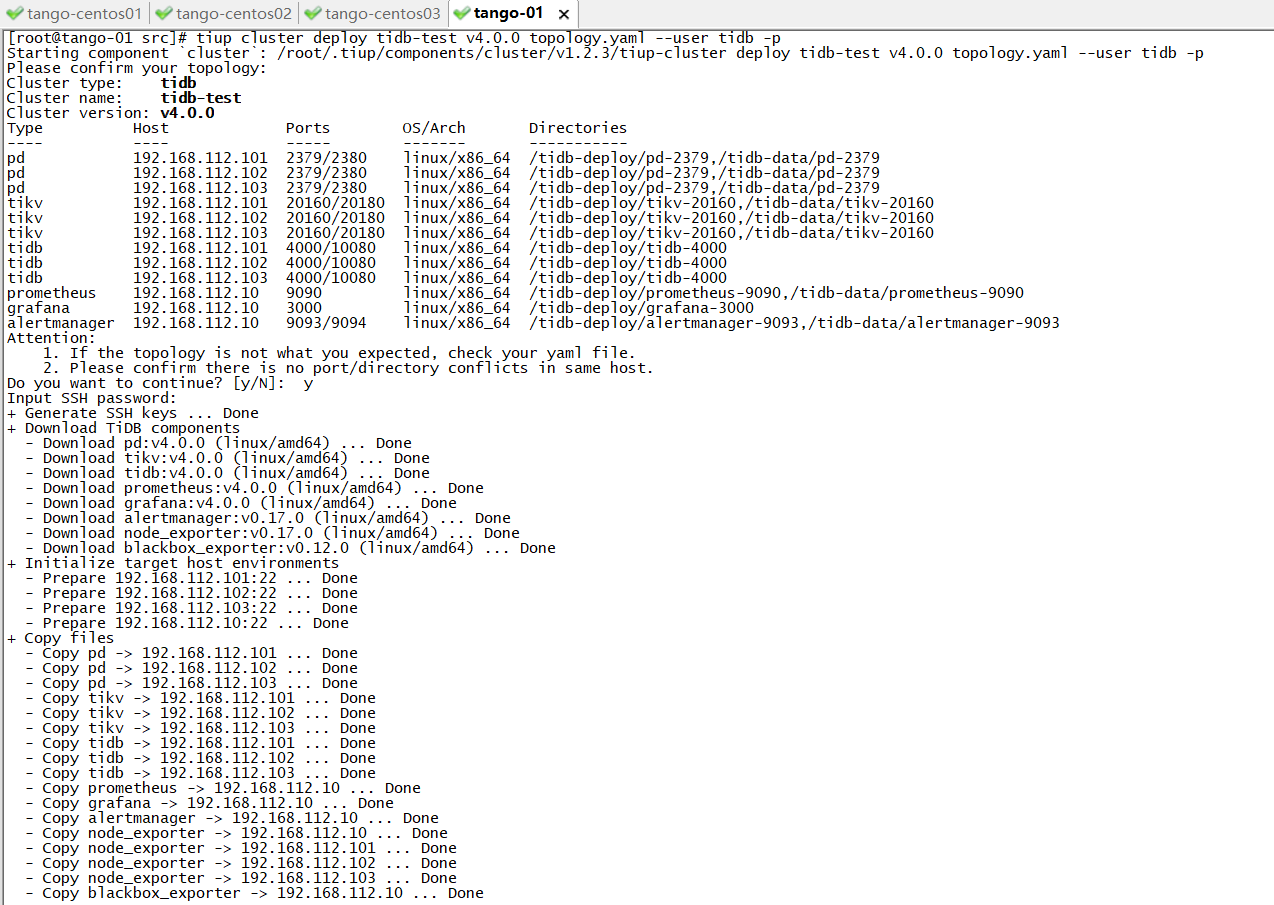
4)执行以下命令部署集群
[root@tango-01 src]# tiup cluster deploy tidb-test v4.0.0 topology.yaml --user tidb -p
Starting component `cluster`: /root/.tiup/components/cluster/v1.2.3/tiup-cluster deploy tidb-test v4.0.0 topology.yaml --user tidb -p
Please confirm your topology:
Cluster type:    tidb
Cluster name:    tidb-test
Cluster version: v4.0.0
Type          Host             Ports        OS/Arch       Directories
----          ----             -----        -------       -----------
pd            192.168.112.101  2379/2380    linux/x86_64  /tidb-deploy/pd-2379,/tidb-data/pd-2379
pd            192.168.112.102  2379/2380    linux/x86_64  /tidb-deploy/pd-2379,/tidb-data/pd-2379
pd            192.168.112.103  2379/2380    linux/x86_64  /tidb-deploy/pd-2379,/tidb-data/pd-2379
tikv          192.168.112.101  20160/20180  linux/x86_64  /tidb-deploy/tikv-20160,/tidb-data/tikv-20160
tikv          192.168.112.102  20160/20180  linux/x86_64  /tidb-deploy/tikv-20160,/tidb-data/tikv-20160
tikv          192.168.112.103  20160/20180  linux/x86_64  /tidb-deploy/tikv-20160,/tidb-data/tikv-20160
tidb          192.168.112.101  4000/10080   linux/x86_64  /tidb-deploy/tidb-4000
tidb          192.168.112.102  4000/10080   linux/x86_64  /tidb-deploy/tidb-4000
tidb          192.168.112.103  4000/10080   linux/x86_64  /tidb-deploy/tidb-4000
prometheus    192.168.112.10   9090         linux/x86_64  /tidb-deploy/prometheus-9090,/tidb-data/prometheus-9090
grafana       192.168.112.10   3000         linux/x86_64  /tidb-deploy/grafana-3000
alertmanager  192.168.112.10   9093/9094    linux/x86_64  /tidb-deploy/alertmanager-9093,/tidb-data/alertmanager-9093
Attention:
    1. If the topology is not what you expected, check your yaml file.
    2. Please confirm there is no port/directory conflicts in same host.
Do you want to continue? [y/N]:  y
Input SSH password:
+ Generate SSH keys ... Done
+ Download TiDB components
  - Download pd:v4.0.0 (linux/amd64) ... Done
  - Download tikv:v4.0.0 (linux/amd64) ... Done
  - Download tidb:v4.0.0 (linux/amd64) ... Done
  - Download prometheus:v4.0.0 (linux/amd64) ... Done
  - Download grafana:v4.0.0 (linux/amd64) ... Done
  - Download alertmanager:v0.17.0 (linux/amd64) ... Done
  - Download node_exporter:v0.17.0 (linux/amd64) ... Done
  - Download blackbox_exporter:v0.12.0 (linux/amd64) ... Done
+ Initialize target host environments
  - Prepare 192.168.112.101:22 ... Done
  - Prepare 192.168.112.102:22 ... Done
  - Prepare 192.168.112.103:22 ... Done
  - Prepare 192.168.112.10:22 ... Done
参数说明:
- 通过 TiUP cluster 部署的集群名称为 tidb-test
- 部署版本为 v4.0.0,其他版本可以执行 tiup list tidb 获取
- 初始化配置文件为 topology.yaml
- –user tidb:通过tidb用户登录到目标主机完成集群部署,该用户需要有ssh到目标机器的权限,并且在目标机器有sudo权限。也可以用其他有ssh和sudo权限的用户完成部署。
- [-i] 及 [-p]:非必选项,如果已经配置免密登陆目标机,则不需填写。否则选择其一即可,[-i] 为可登录到部署机root用户(或 --user 指定的其他用户)的私钥,也可使用 [-p] 交互式输入该用户的密码
日志结尾输出 “Deployed cluster tidb-test successfully, you can start the cluster via tiup cluster start tidb-test”关键词,表示部署成功。
5)查看TiUP管理的集群情况
[root@tango-01 src]# tiup cluster list
Starting component `cluster`: /root/.tiup/components/cluster/v1.2.3/tiup-cluster list
Name       User  Version  Path                                            PrivateKey
----       ----  -------  ----                                            ----------
tidb-test  tidb  v4.0.0   /root/.tiup/storage/cluster/clusters/tidb-test  /root/.tiup/storage/cluster/clusters/tidb-test/ssh/id_rsa
TiUP支持管理多个TiDB集群,该命令会输出当前通过TiUP cluster管理的所有集群信息,包括集群名称、部署用户、版本、密钥信息等。
6)检查部署的TiDB集群情况
[root@tango-01 src]# tiup cluster display tidb-test
Starting component `cluster`: /root/.tiup/components/cluster/v1.2.3/tiup-cluster display tidb-test
Cluster type:    tidb
Cluster name:    tidb-test
Cluster version: v4.0.0
SSH type:        builtin
ID                     Role          Host             Ports        OS/Arch       Status    Data Dir                      Deploy Dir
--                     ----          ----             -----        -------       ------    --------                      ----------
192.168.112.10:9093    alertmanager  192.168.112.10   9093/9094    linux/x86_64  inactive  /tidb-data/alertmanager-9093  /tidb-deploy/alertmanager-9093
192.168.112.10:3000    grafana       192.168.112.10   3000         linux/x86_64  inactive  -                             /tidb-deploy/grafana-3000
192.168.112.101:2379   pd            192.168.112.101  2379/2380    linux/x86_64  Down      /tidb-data/pd-2379            /tidb-deploy/pd-2379
192.168.112.102:2379   pd            192.168.112.102  2379/2380    linux/x86_64  Down      /tidb-data/pd-2379            /tidb-deploy/pd-2379
192.168.112.103:2379   pd            192.168.112.103  2379/2380    linux/x86_64  Down      /tidb-data/pd-2379            /tidb-deploy/pd-2379
192.168.112.10:9090    prometheus    192.168.112.10   9090         linux/x86_64  inactive  /tidb-data/prometheus-9090    /tidb-deploy/prometheus-9090
192.168.112.101:4000   tidb          192.168.112.101  4000/10080   linux/x86_64  Down      -                             /tidb-deploy/tidb-4000
192.168.112.102:4000   tidb          192.168.112.102  4000/10080   linux/x86_64  Down      -                             /tidb-deploy/tidb-4000
192.168.112.103:4000   tidb          192.168.112.103  4000/10080   linux/x86_64  Down      -                             /tidb-deploy/tidb-4000
192.168.112.101:20160  tikv          192.168.112.101  20160/20180  linux/x86_64  Down      /tidb-data/tikv-20160         /tidb-deploy/tikv-20160
192.168.112.102:20160  tikv          192.168.112.102  20160/20180  linux/x86_64  Down      /tidb-data/tikv-20160         /tidb-deploy/tikv-20160
192.168.112.103:20160  tikv          192.168.112.103  20160/20180  linux/x86_64  Down      /tidb-data/tikv-20160         /tidb-deploy/tikv-20160
Total nodes: 12
输出包括 tidb-test 集群中实例 ID、角色、主机、监听端口和状态(由于还未启动,所以状态为 Down/inactive)、目录信息。
7)启动集群
[root@tango-01 src]# tiup cluster start tidb-test
Starting component `cluster`: /root/.tiup/components/cluster/v1.2.3/tiup-cluster start tidb-test
Starting cluster tidb-test...
+ [ Serial ] - SSHKeySet: privateKey=/root/.tiup/storage/cluster/clusters/tidb-test/ssh/id_rsa, publicKey=/root/.tiup/storage/cluster/clusters/tidb-test/ssh/id_rsa.pub
+ [Parallel] - UserSSH: user=tidb, host=192.168.112.10
+ [Parallel] - UserSSH: user=tidb, host=192.168.112.101
+ [Parallel] - UserSSH: user=tidb, host=192.168.112.102
+ [Parallel] - UserSSH: user=tidb, host=192.168.112.103
+ [Parallel] - UserSSH: user=tidb, host=192.168.112.101
+ [Parallel] - UserSSH: user=tidb, host=192.168.112.102
+ [Parallel] - UserSSH: user=tidb, host=192.168.112.103
+ [Parallel] - UserSSH: user=tidb, host=192.168.112.101
+ [Parallel] - UserSSH: user=tidb, host=192.168.112.102
+ [Parallel] - UserSSH: user=tidb, host=192.168.112.103
+ [Parallel] - UserSSH: user=tidb, host=192.168.112.10
+ [Parallel] - UserSSH: user=tidb, host=192.168.112.10
+ [ Serial ] - StartCluster
Starting component pd
        Starting instance pd 192.168.112.103:2379
        Starting instance pd 192.168.112.101:2379
        Starting instance pd 192.168.112.102:2379
        Start pd 192.168.112.101:2379 success
        Start pd 192.168.112.102:2379 success
        Start pd 192.168.112.103:2379 success
Starting component node_exporter
        Starting instance 192.168.112.101
        Start 192.168.112.101 success
Starting component blackbox_exporter
        Starting instance 192.168.112.101
        Start 192.168.112.101 success
Starting component node_exporter
        Starting instance 192.168.112.102
        Start 192.168.112.102 success
Starting component blackbox_exporter
        Starting instance 192.168.112.102
        Start 192.168.112.102 success
Starting component node_exporter
        Starting instance 192.168.112.103
        Start 192.168.112.103 success
Starting component blackbox_exporter
        Starting instance 192.168.112.103
        Start 192.168.112.103 success
Starting component tikv
        Starting instance tikv 192.168.112.103:20160
        Starting instance tikv 192.168.112.101:20160
        Starting instance tikv 192.168.112.102:20160
        Start tikv 192.168.112.103:20160 success
        Start tikv 192.168.112.102:20160 success
        Start tikv 192.168.112.101:20160 success
Starting component tidb
        Starting instance tidb 192.168.112.103:4000
        Starting instance tidb 192.168.112.101:4000
        Starting instance tidb 192.168.112.102:4000
        Start tidb 192.168.112.103:4000 success
        Start tidb 192.168.112.102:4000 success
        Start tidb 192.168.112.101:4000 success
Starting component prometheus
        Starting instance prometheus 192.168.112.10:9090
        Start prometheus 192.168.112.10:9090 success
Starting component node_exporter
        Starting instance 192.168.112.10
        Start 192.168.112.10 success
Starting component blackbox_exporter
        Starting instance 192.168.112.10
        Start 192.168.112.10 success
Starting component grafana
        Starting instance grafana 192.168.112.10:3000
        Start grafana 192.168.112.10:3000 success
Starting component alertmanager
        Starting instance alertmanager 192.168.112.10:9093
        Start alertmanager 192.168.112.10:9093 success
+ [ Serial ] - UpdateTopology: cluster=tidb-test
Started cluster `tidb-test` successfully
结果输出 Started cluster tidb-test successfully 标志启动成功。
8)验证集群运行状态
[root@tango-01 src]# tiup cluster display tidb-test
Starting component `cluster`: /root/.tiup/components/cluster/v1.2.3/tiup-cluster display tidb-test
Cluster type:    tidb
Cluster name:    tidb-test
Cluster version: v4.0.0
SSH type:        builtin
ID                     Role          Host             Ports        OS/Arch       Status  Data Dir                      Deploy Dir
--                     ----          ----             -----        -------       ------  --------                      ----------
192.168.112.10:9093    alertmanager  192.168.112.10   9093/9094    linux/x86_64  Up      /tidb-data/alertmanager-9093  /tidb-deploy/alertmanager-9093
192.168.112.10:3000    grafana       192.168.112.10   3000         linux/x86_64  Up      -                             /tidb-deploy/grafana-3000
192.168.112.101:2379   pd            192.168.112.101  2379/2380    linux/x86_64  Up|L    /tidb-data/pd-2379            /tidb-deploy/pd-2379
192.168.112.102:2379   pd            192.168.112.102  2379/2380    linux/x86_64  Up|UI   /tidb-data/pd-2379            /tidb-deploy/pd-2379
192.168.112.103:2379   pd            192.168.112.103  2379/2380    linux/x86_64  Up      /tidb-data/pd-2379            /tidb-deploy/pd-2379
192.168.112.10:9090    prometheus    192.168.112.10   9090         linux/x86_64  Up      /tidb-data/prometheus-9090    /tidb-deploy/prometheus-9090
192.168.112.101:4000   tidb          192.168.112.101  4000/10080   linux/x86_64  Up      -                             /tidb-deploy/tidb-4000
192.168.112.102:4000   tidb          192.168.112.102  4000/10080   linux/x86_64  Up      -                             /tidb-deploy/tidb-4000
192.168.112.103:4000   tidb          192.168.112.103  4000/10080   linux/x86_64  Up      -                             /tidb-deploy/tidb-4000
192.168.112.101:20160  tikv          192.168.112.101  20160/20180  linux/x86_64  Up      /tidb-data/tikv-20160         /tidb-deploy/tikv-20160
192.168.112.102:20160  tikv          192.168.112.102  20160/20180  linux/x86_64  Up      /tidb-data/tikv-20160         /tidb-deploy/tikv-20160
192.168.112.103:20160  tikv          192.168.112.103  20160/20180  linux/x86_64  Up      /tidb-data/tikv-20160         /tidb-deploy/tikv-20160
Total nodes: 12
结果输出中Status状态信息为 Up 说明集群状态正常
2.3 TiDB Dashboard控制台
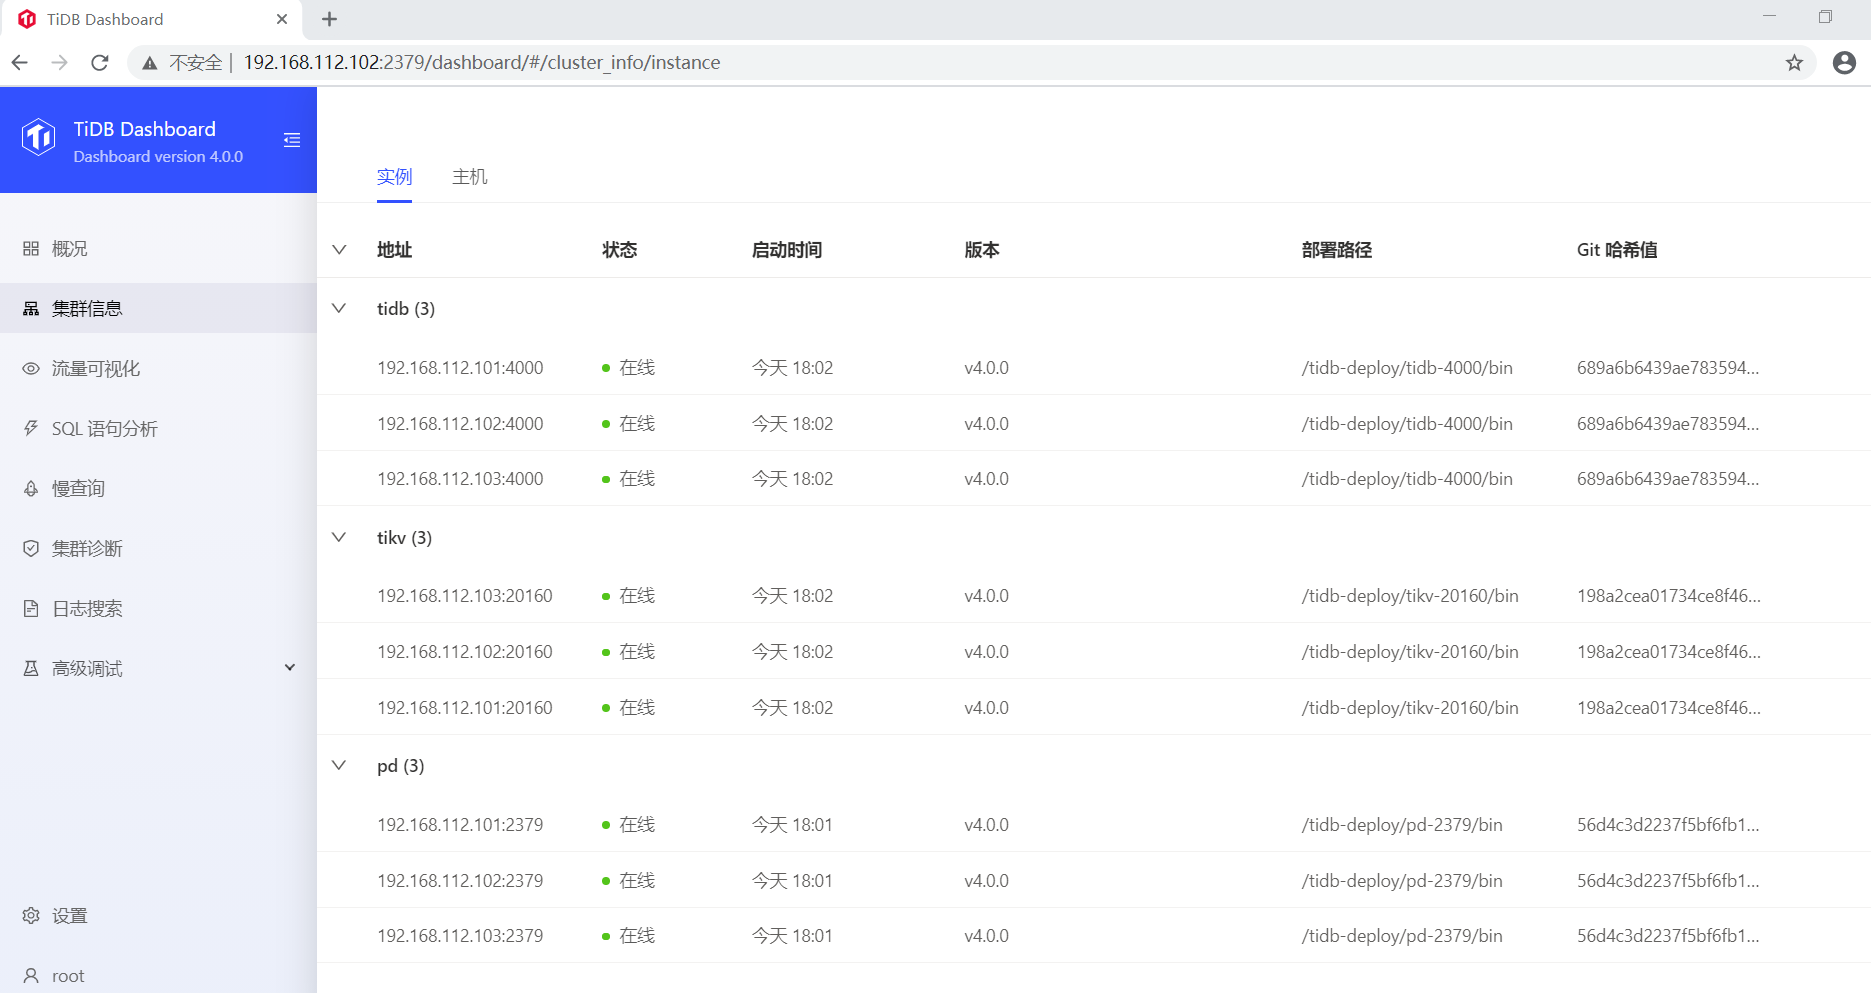
2.3.1 查看TiDB Dashboard检查TiDB集群状态
通过http://192.168.112.102:2379/dashboard登录TiDB Dashboard,登录用户和口令为TiDB 数据库 root 用户和口令,默认密码为空。主页面显示 TiDB 集群中节点信息:
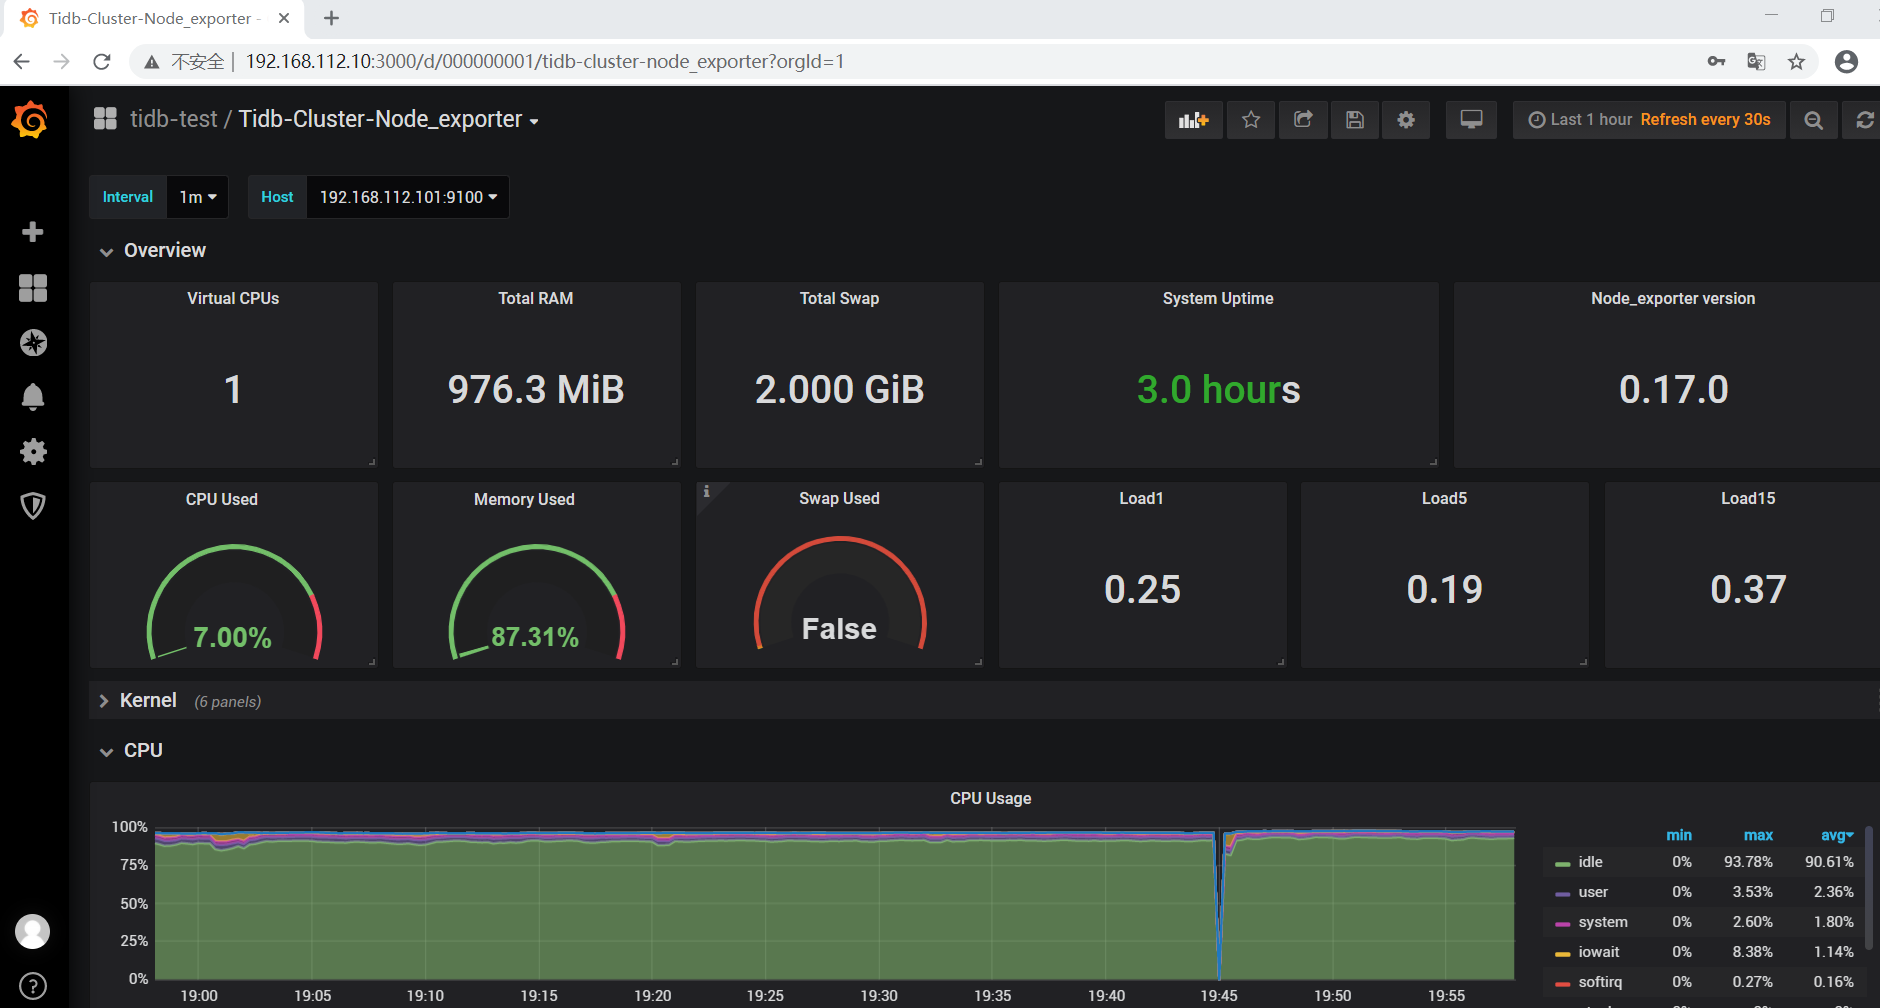
2.3.2 查看 Grafana监控 Overview页面检查TiDB集群状态
通过http://192.168.112.10:3000/登录 Grafana 监控,默认用户名及密码为 admin/admin。点击 Overview 监控页面检查 TiDB 端口和负载监控信息。
2.3.3 登录数据库执行简单DML/DDL操作和查询SQL语句
1)执行如下命令登录数据库
[root@tango-01 mysql]# ./bin/mysql -u root -h 192.168.112.101 -P 4000
Welcome to the MySQL monitor.  Commands end with ; or \g.
Your MySQL connection id is 23
Server version: 5.7.25-TiDB-v4.0.0 TiDB Server (Apache License 2.0) Community Edition, MySQL 5.7 compatible

Copyright (c) 2000, 2015, Oracle and/or its affiliates. All rights reserved.

Oracle is a registered trademark of Oracle Corporation and/or its
affiliates. Other names may be trademarks of their respective
owners.

Type 'help;' or '\h' for help. Type '\c' to clear the current input statement.

mysql>
2)检查TiDB版本
mysql> select tidb_version()\G
*************************** 1. row ***************************
tidb_version(): Release Version: v4.0.0
Edition: Community
Git Commit Hash: 689a6b6439ae7835947fcaccf329a3fc303986cb
Git Branch: heads/refs/tags/v4.0.0
UTC Build Time: 2020-05-28 01:37:40
GoVersion: go1.13
Race Enabled: false
TiKV Min Version: v3.0.0-60965b006877ca7234adaced7890d7b029ed1306
Check Table Before Drop: false
1 row in set (0.00 sec)
3)创建tango database
mysql> create database tango;
Query OK, 0 rows affected (1.41 sec)

mysql> use tango
Database changed
4)创建tab_tidb 表
mysql> CREATE TABLE `tab_tidb` (
    -> `id` int(11) NOT NULL AUTO_INCREMENT,
    -> `name` varchar(20) NOT NULL DEFAULT '',
    -> `age` int(11) NOT NULL DEFAULT 0,
    -> `version` varchar(20) NOT NULL DEFAULT '',
    -> PRIMARY KEY (`id`),
    -> KEY `idx_age` (`age`));
Query OK, 0 rows affected (0.44 sec)

mysql> show tables;
+-----------------+
| Tables_in_tango |
+-----------------+
| tab_tidb        |
+-----------------+
1 row in set (0.00 sec)
5)插入数据
mysql> insert into `tab_tidb` values (1,'TiDB',5,'TiDB-v4.0.0');
Query OK, 1 row affected (0.31 sec)

mysql> select * from tab_tidb;
+----+------+-----+-------------+
| id | name | age | version     |
+----+------+-----+-------------+
|  1 | TiDB |   5 | TiDB-v4.0.0 |
+----+------+-----+-------------+
1 row in set (0.00 sec)
6)查看TiKV store状态、store_id、存储情况以及启动时间
mysql> select STORE_ID,ADDRESS,STORE_STATE,STORE_STATE_NAME,CAPACITY,AVAILABLE,UPTIME from INFORMATION_SCHEMA.TIKV_STORE_STATUS;
+----------+-----------------------+-------------+------------------+----------+-----------+------------------+
| STORE_ID | ADDRESS               | STORE_STATE | STORE_STATE_NAME | CAPACITY | AVAILABLE | UPTIME           |
+----------+-----------------------+-------------+------------------+----------+-----------+------------------+
|        1 | 192.168.112.103:20160 |           0 | Up               | 16.99GiB | 7.374GiB  | 19m45.938666804s |
|        4 | 192.168.112.102:20160 |           0 | Up               | 16.99GiB | 7.06GiB   | 19m43.552831798s |
|        5 | 192.168.112.101:20160 |           0 | Up               | 16.99GiB | 7.319GiB  | 19m46.384409015s |
+----------+-----------------------+-------------+------------------+----------+-----------+------------------+
3 rows in set (0.20 sec)
参考资料
- https://docs.pingcap.com/zh/tidb/stable/
- https://asktug.com/_/tidb-performance-map/#/overview
转载请注明原文地址:https://www.modb.pro/db/80191
文章会同步在公众号“牧羊人的方向”更新,感兴趣的可以关注公众号,谢谢!