


Dataguard_network_tuning_tvd_layout
5墨值下载
info@trivadis.com . www.trivadis.com . Info-Tel. 0800 87 482 347 . Datum 29.04.2009 . Seite 1 / 8
Data Guard in SYNC mode – does my DB suffer
from network weakness ?
Yann Neuhaus – Senior Consultant – 16.oct.2007
Reviewed Yann Neuhaus – Principal Consultant – 28.apr.2009
(issues with v$system_event metrics and improved interpretation)
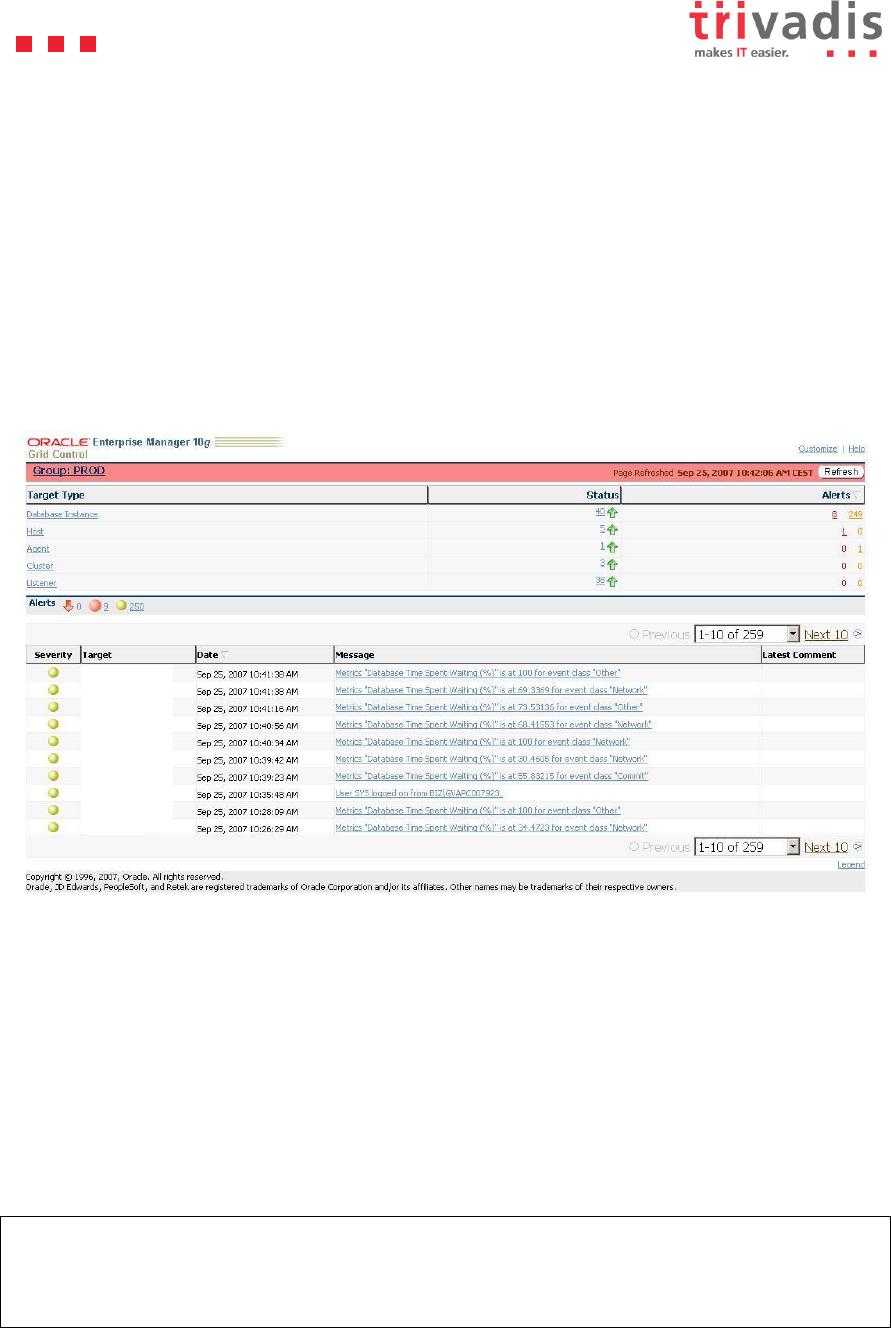
Data Guard network tuning is always a big and nice challenge which should be taken seriously.
For instance, my Grid Control console is often polluted by warnings about wait events of the
network event class :
Is my Data Guard setup really suffering from poor performance?
Before any tuning action each Data Guard administrator should know and read both white papers
listed in the metalink note 387174.1 For Oracle 10.2 this note points to:
MAA_WP_10gR2_DataGuardNetworkBestPractices.pdf
Without dwelling on the details of this Oracle document, find below the main settings required
for an ideal network configuration for Data Guard:
First of all calculate the Bandwidth Delay Product (BDP). For this purpose try to identify the
Round Trip Time using ping:
ping ttchp02
PING ttchp02.ttc.trivadis.com: (172.16.65.7): 56 data bytes
64 bytes from 172.16.65.7: icmp_seq=0 ttl=255 time=0 ms
64 bytes from 172.16.65.7: icmp_seq=1 ttl=255 time=0 ms
64 bytes from 172.16.65.7: icmp_seq=2 ttl=255 time=0 ms
On AIX, the ping command shows that the elapsed time is equal to 0 ms, therefore the estimated
RTT is 1 ms (we take the pessimistic approach).

info@trivadis.com . www.trivadis.com . Info-Tel. 0800 87 482 347 . Datum 29.04.2009 . Seite 2 / 8
On a Linux machine fractions of milliseconds could be displayed:
ping 172.17.38.8
PING 172.17.38.8 (172.17.38.8) 56(84) bytes of data.
64 bytes from 172.17.38.8: icmp_seq=4 ttl=64 time=0.339 ms
64 bytes from 172.17.38.8: icmp_seq=5 ttl=64 time=0.424 ms
RTT * Bandwidth =
0.001 (1 ms) * 1'000'000'000 (1Gb/s) / 8 (to get bytes) =
125'000
It is recommended to set the OracleNet TCP parameters to three times the BDP: 375'000
In sqlnet.ora on the primary and standby server :
RECV_BUF_SIZE=375000
SEND_BUF_SIZE=375000
Make also sure that the parameter TCP.NODELAY (per default set to yes) has not been explicitly
set to “no”. Either do not set the parameter or set it to “yes” :
TCP.NODELAY=yes
This parameter will have the effect that each change vector(s) package will be directly transmitted
to the standby site without waiting for another packet. The Naggle algorithm is therefore disabled.
The goal is to privilege the primary database performance even if the network utilization won’t be
optimal.
More info about the Naggle algorithm and OracleNet (Although this is an old publication the
fundaments are correctly explained) :
http://www.miracleas.dk/tools/Miracle_4_nagle.pdf
On AIX, the platform used during these tests some tuning are requested.
Set the TCP queue length :
no -o ipqmaxlen=100
Set the send and receive space as documented under :
http://publib16.boulder.ibm.com/pseries/en_US/aixbman/prftungd/netperf3.htm#i79137
tcp_sendspace = 131072
tcp_recvspace = 65536
Once these best practices have been configured we can investigate why the Grid Control
warnings still occur. The database is up since about 3 days (72 hours) :
SYS@STAGPRD1 > select sysdate from dual;
SYSDATE
--------------------
25-SEP-2007 16:07:15
SYS@STAGPRD1 > select startup_time from v$instance;
STARTUP_TIME
--------------------
22-SEP-2007 19:28:40
First of all try to identify the wait classes which generated the most important wait times:
set lines 130
select * from V$SYSTEM_WAIT_CLASS
of 8
5墨值下载
【版权声明】本文为墨天轮用户原创内容,转载时必须标注文档的来源(墨天轮),文档链接,文档作者等基本信息,否则作者和墨天轮有权追究责任。如果您发现墨天轮中有涉嫌抄袭或者侵权的内容,欢迎发送邮件至:contact@modb.pro进行举报,并提供相关证据,一经查实,墨天轮将立刻删除相关内容。
下载排行榜

评论